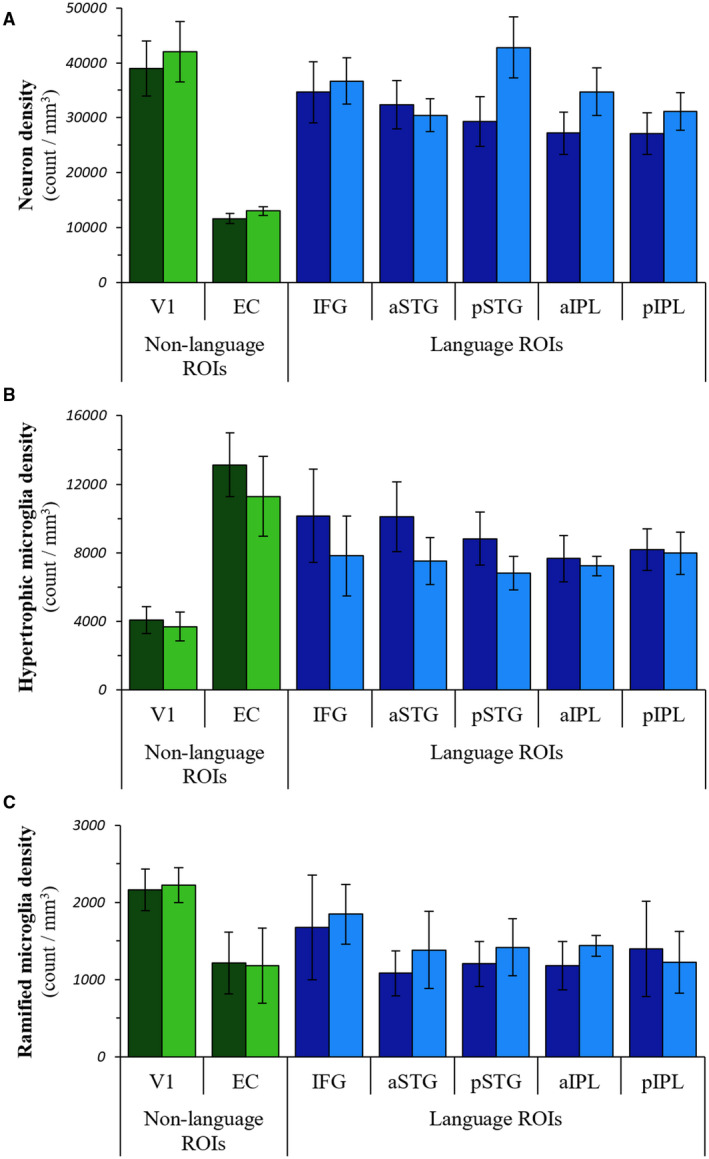
Figure 3.

Distributions of neurons and microglial subtypes in PPA‐AD. The regional distributions of neuron densities (A), hypertrophic microglia densities (B), and ramified microglia densities (C) in PPA‐AD. Note that tests were not performed on individual regions. Left language ROIs = dark blue bars; right language homologues = blue bars; left non‐language ROIs = dark green bars; right non‐language ROIs = green bars.
