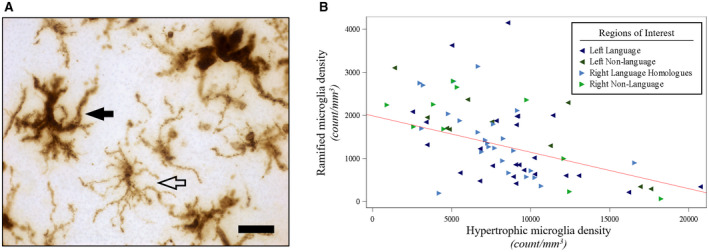
Figure 4.

Hypertrophic microglia densities were negatively associated with ramified microglia densities in PPA‐AD. (A) Representative photomicrograph of morphologic subtypes of HLA‐DR‐positive microglia. Hypertrophic microglia (filled arrow) displayed darker immunoreactivity for HLA‐DR throughout their enlarged somas, and thicker, shorter processes relative to ramified microglia (open arrow), which displayed lighter immunoreactivity for HLA‐DR throughout their smaller somas and thinner, more branched arbor. Photomicrograph acquired at 63× magnification. Scale bar set to 25 µm. (B) There was a negative relationship (P < 0.01) between ramified microglia densities and hypertrophic microglia densities, as shown in the predicted line (slope: −0.08) from the mixed model, using the left hemisphere, language regions, and the medians for age at death (64) and postmortem interval (14) for the adjusting variables. Data displayed include all 5 participants with 14 observations each (five language and two non‐language regions per hemisphere).
