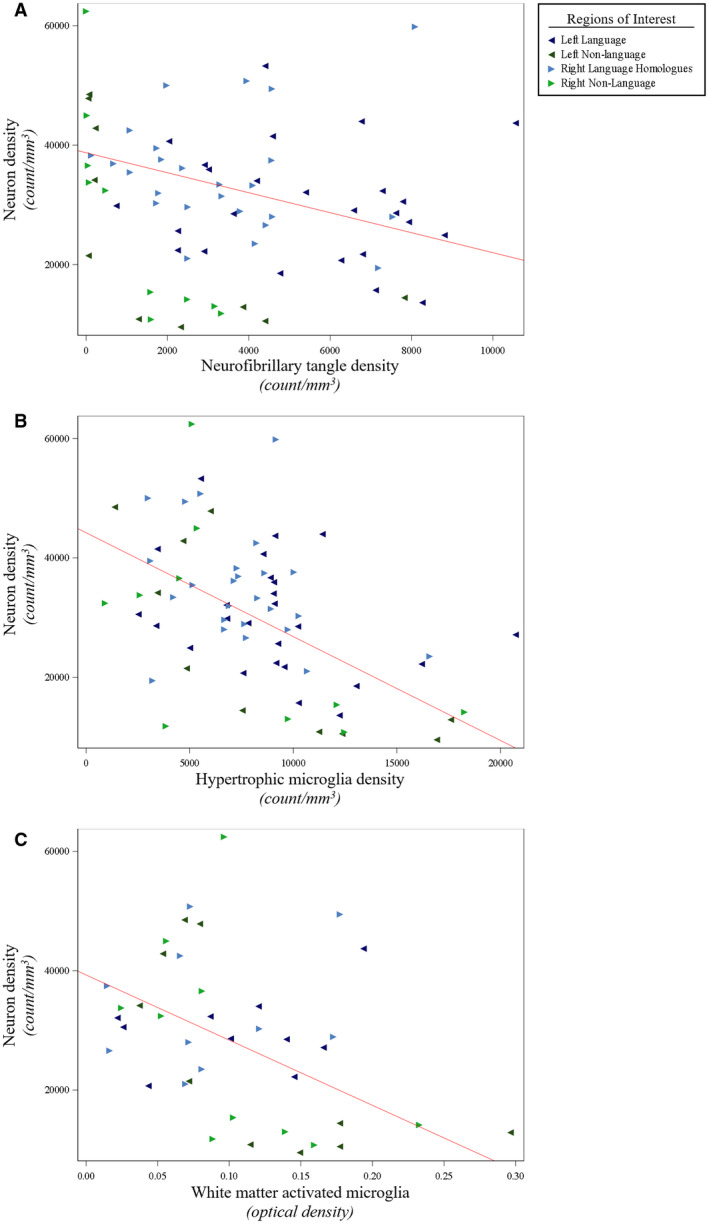
Figure 6.

Smaller neuron densities were associated with larger densities of NFTs and activated microglia in PPA‐AD. (A) There was a negative relationship between neuron densities and NFT densities (P = 0.01), as shown in the predicted line (slope: −1.68) from the mixed model. Data displayed include all 5 participants with 14 observations each (five language and two non‐language regions per hemisphere). (B) There was a negative relationship between neuron densities and activated hypertrophic microglia densities (P < 0.01), as displayed by the predicted line (slope: −1.74) from the mixed model. Data displayed include all 5 participants with 14 observations each (five language and two non‐language regions per hemisphere). (C) There was a negative relationship between neuron densities and optical densities of white matter activated microglia (P < 0.01), as shown in the predicted line (slope: −109 245). Data displayed include all five participants with eight observations each (two language and two non‐language regions per hemisphere). When creating the predicted lines, we used the left hemisphere, language regions, and the medians for age at death (64) and postmortem interval (14) for the adjusting variables.
