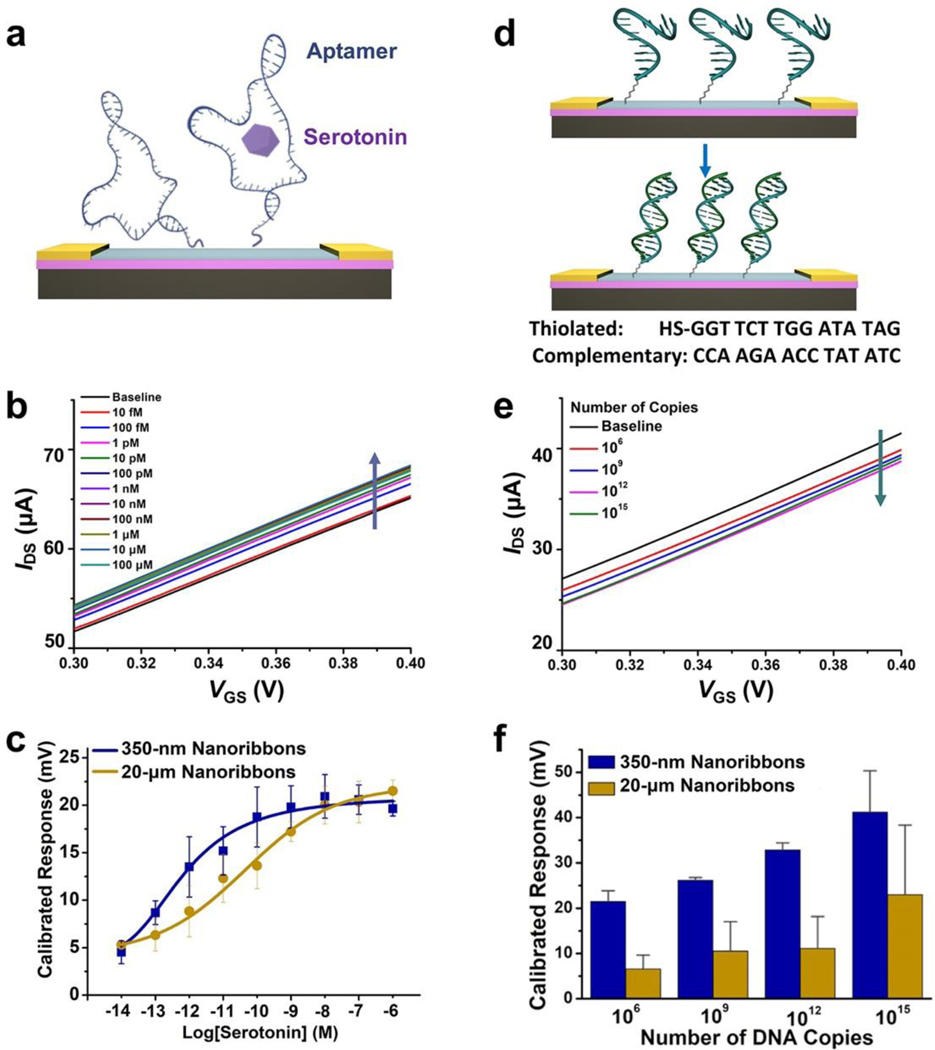
Figure 5. (a).
Schematic illustration of serotonin detection using aptamer-functionalized In2O3 field-effect transistor (FET) biosensors. (b) Representative transfer curves for serotonin responses from 10 fM to 1 μM for 350-nm In2O3 nanoribbon FET biosensors. (c) Calibrated response curves for serotonin from 350-nm- vs 20-μm-wide In2O3 nanoribbon FET biosensors. Error bars are standard errors of the means for N=3 350-nm-wide nanoribbon and N=2 20-μm-wide nanoribbon devices. (d) Schematic illustration of DNA hybridization detection. (e) Representative transfer curves for responses for complementary DNA hybridization (106 to 1015 copies) for 350-nm In2O3 nanoribbon FET biosensors. (f) Calibrated responses for complementary DNA hybridization for 350-nm- vs 20-μm-wide In2O3 nanoribbon FET biosensors. Error bars are standard errors of the means for N=2 350-nm-wide nanoribbon and N=3 20-μm-wide microribbon devices.

