
Figure 6 (online only).
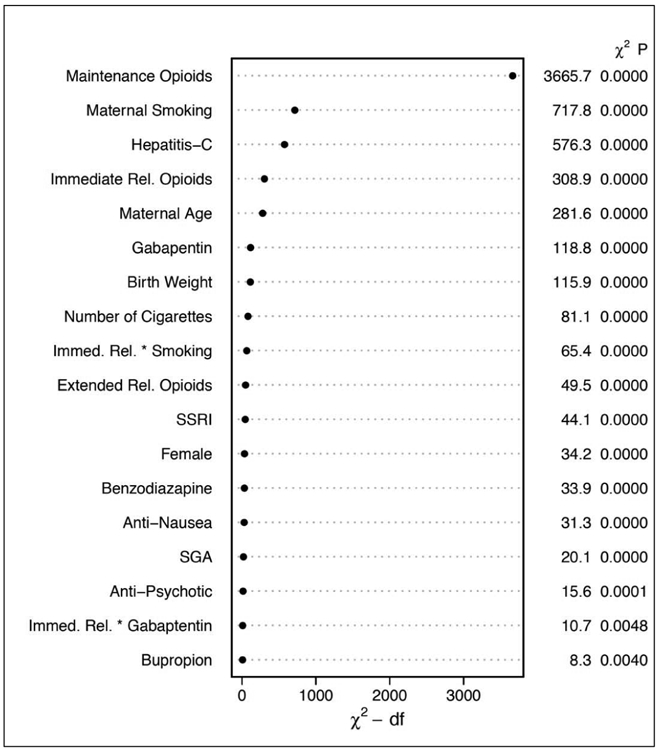
General Population Model Relative Contribution of Each Covariate to the Final Model Using the Relative Chi-square.
* Dot charts depicting the importance of variables in the prediction model based on clinical predictors, as measured by Wald chi-square and chi-square minus degrees of freedom. Statistics are provided for main effects and two-way interactions (represented as A * B) with p-values calculated using separate multiple degree of freedom chunk tests.