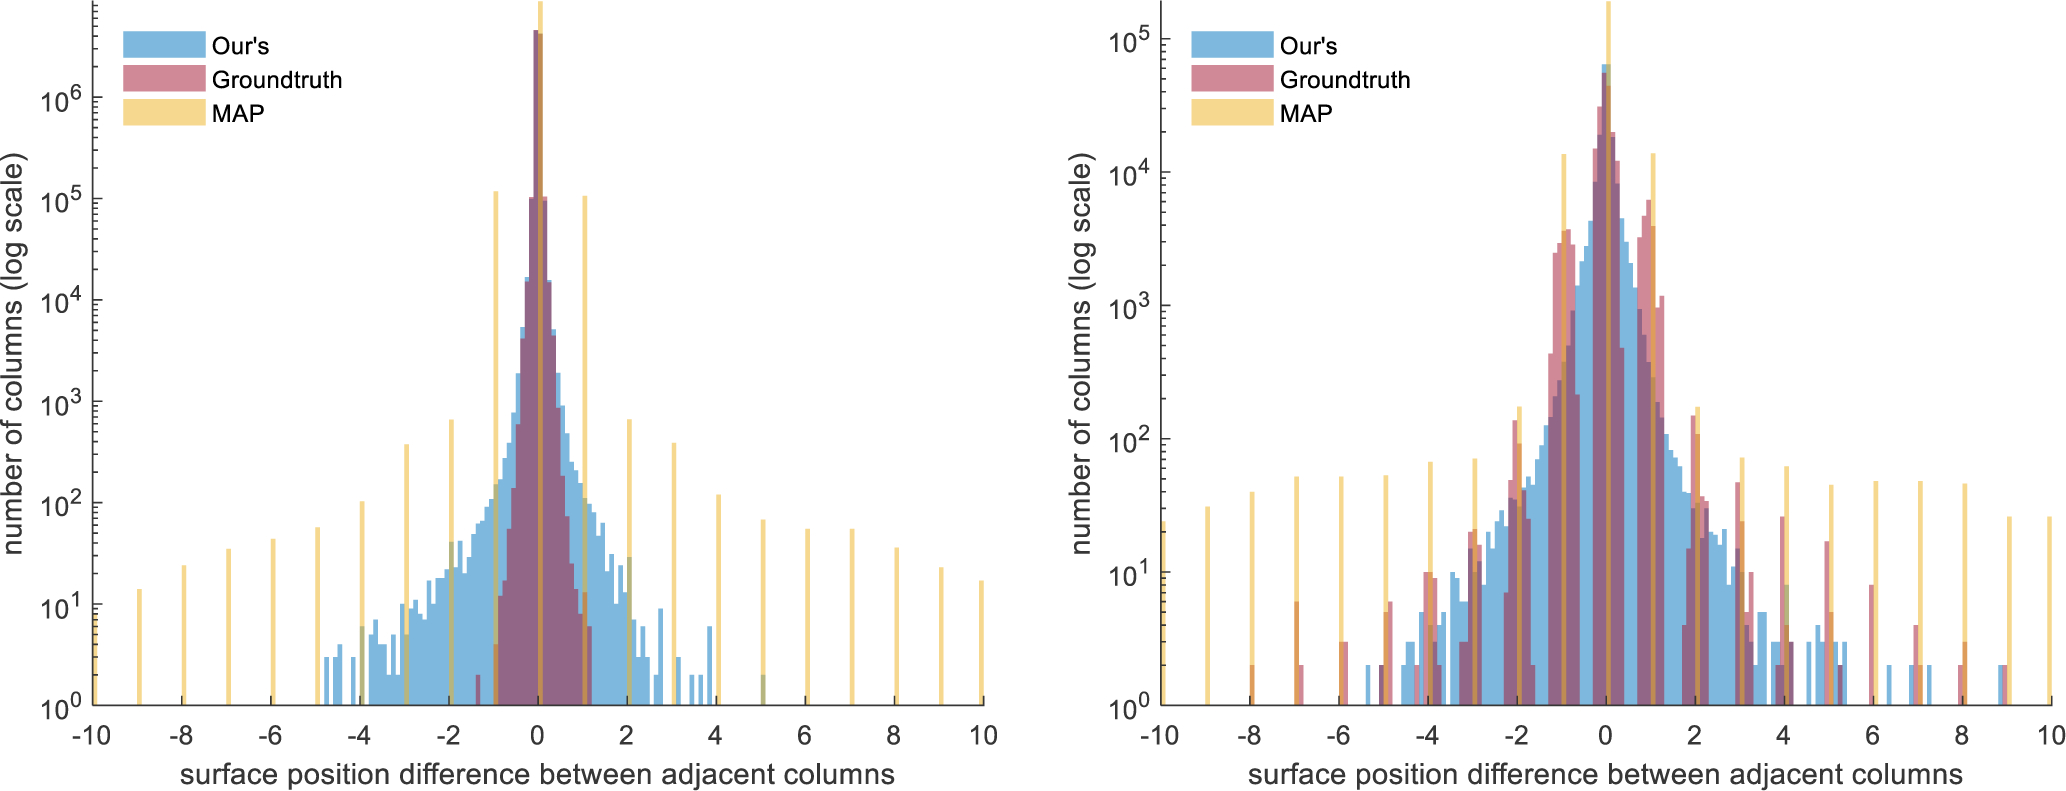
Fig. 8.

Histogram of the surface distance between adjacent columns |sj(xi +1) − sj(xi)| for our method, the proposed soft-argmax inference from qi’s (Ours), manual delineation (Groundtruth), and maximum a posterior from the qi’s (MAP). Left: The histogram for the HC/PwMS data set. Right: The histogram for the DME data set. Note the y-axis uses a log-scale.
