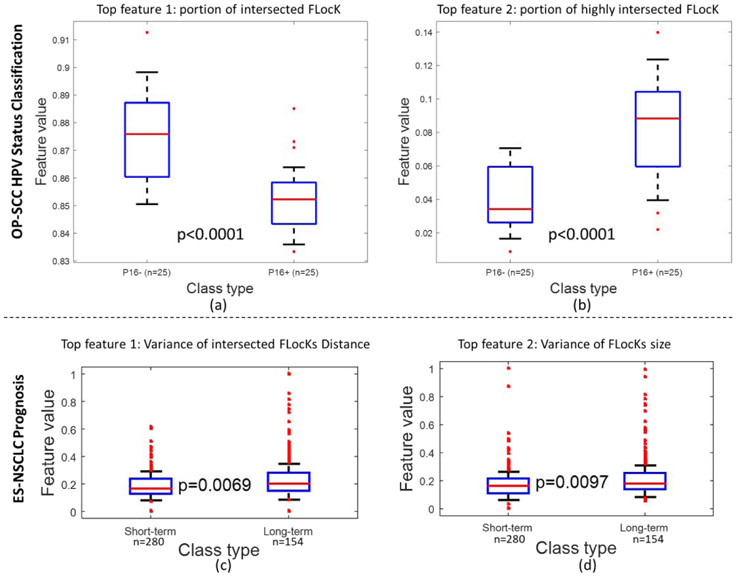
Figure 3:
The box plots of top two features for OP-SCC HPV status classification (upper panel (a) and (b)), and ES-NSCLC (lower panel, (c) to (d)). The p value was evaluated using WRST with all patients in training cohort. The separation between two groups of patients are statistically significant considering the significant level as 0.05.

