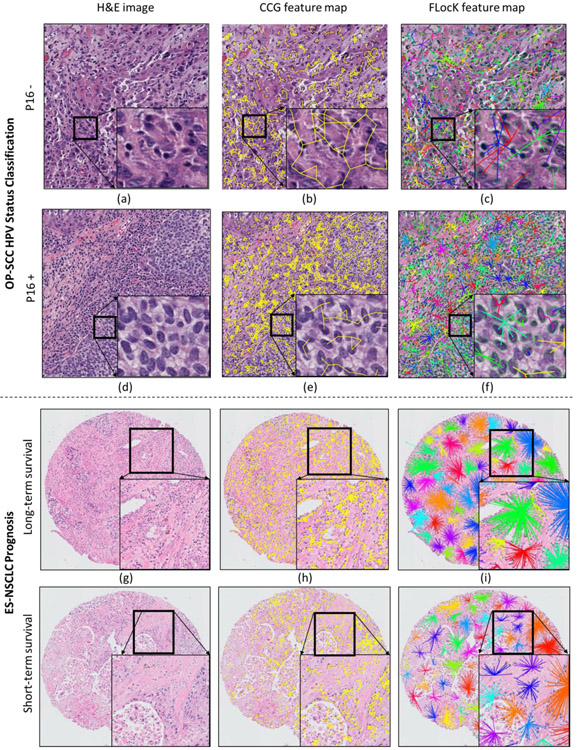
Figure 4:
Representative H&E stained images for OP-SCC HPV status classification (upper panel (a) to (f)), and ES-NSCLC (lower panel, (g) to (l)). The first column shows the original image, the second column shows the CCG configuration, and the third column shows the FLocK configuration, in which different FLocKs have different colors. The FLocKs shown in (c), (f), (i), and (l) reveal the grouping of different sub-type of nuclear as distinct clusters, unlike the CCG representation (shown in (b), (e), (h), and (k)) which does not distinguish between them.

