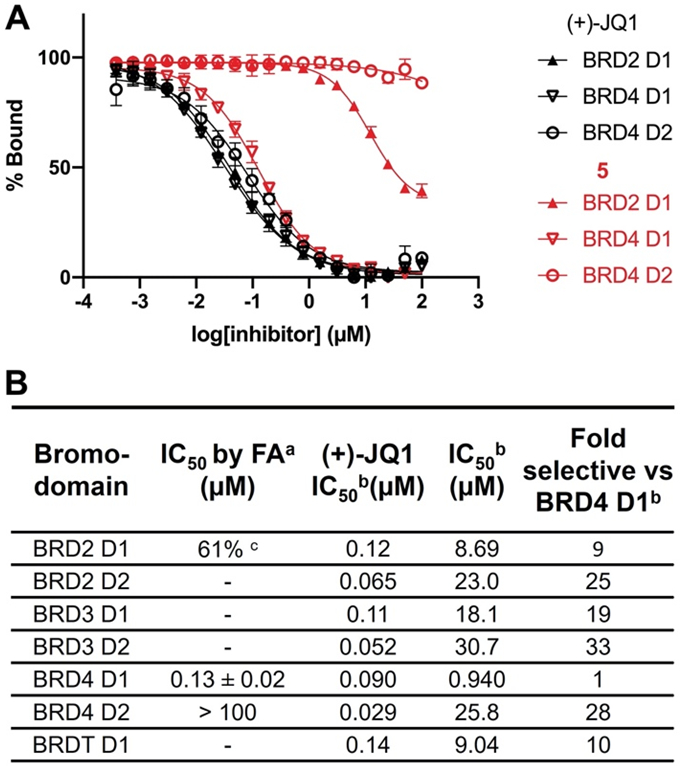
Figure 2. Competitive binding experiments of 5 and (+)-JQ1 by fluorescence anisotropy and a commercial AlphaScreen assay demonstrates selectivity for BRD4 D1.

(A) Competitive binding curves of 5 (in red) and (+)-JQ1 (in black) by fluorescence anisotropy against BRD2 D1, BRD4 D1, and BRD4 D2. (B) IC50 values of 5 and (+)-JQ1 by fluorescence anisotropy and a commercial AlphaScreen assay.
a Data represents the mean and SEM of biological replicates.
b IC50 values were determined by a commercial AlphaScreen assay. Data represents the mean of two biological replicates.
c 61% inhibition at 100 μM.
