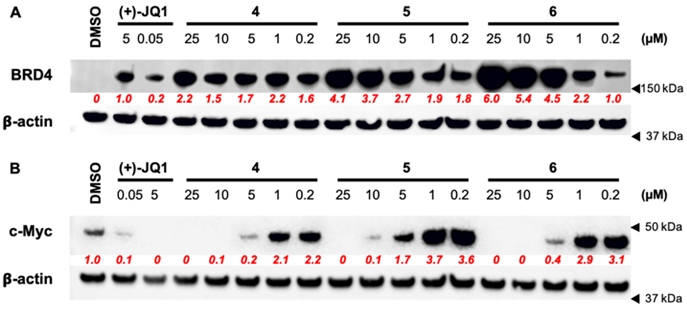
Figure 4. Target engagement, cellular permeability, and transcriptional effects of 4, 5, and 6 in MM.1S cells.

(A) Cellular target engagement of BRD4 and cell permeability of 4, 5, 6 by isothermal dose-response stability profiling after 1 h. treatment of MM.1S cells. Quantified densitometry relative to 5 μM (+)-JQ1 intensity levels shown in red. (B) Representative western blot of expressed c-Myc levels after 8 h. treatment of MM.1S cells. Quantified densitometry relative to untreated (DMSO) intensity levels in red. Full images of representative blots shown in Figure S15.
