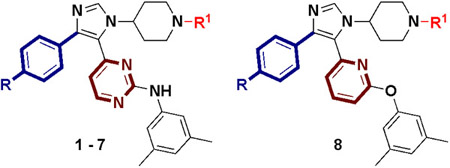
Table 1.
IC50 values of 1 and analogues against BRD4 D1 by fluorescence anisotropy and AlphaScreen. Kinase activity against p38α.
 |
|||||
|---|---|---|---|---|---|
| Cpd | R = | R1 = | BRD4 D1 IC50 by FAa(μM) |
BRD4 D1 IC50 by AlphaScreenb(μM) |
p38α Kdc(nM) |
| (+)-JQ1 | - | - | 0.037 ± 0.008 | 0.051 ± 0.02† | - |
| 1 | F | H | 11 ± 0.8 | 3.8 | 0.47 |
| 2 | H | H | 4.5 ± 0.2 | 2.6 | - |
| 3 | CH3 | H | 1.2 ± 0.2 | 1.1 | - |
| 4 | CF3 | H | 0.31 ± 0.06 | 0.64 | 260 |
| 5 | CF3 | (CH2)2NH2 | 0.13 ± 0.01 | 0.29 | 1900 |
| 6 | CF3 | (CH2)2N(CH3)2 | 0.15 ± 0.03 | 0.20 | - |
| 7 | CF3 | (CH2)2NHCOCH3 | 0.42 ± 0.01 | 1.5 | - |
| 8 | CF3 | (CH2)2NH2 | 1.1 ± 0.2 | 1.3 | >30,000 |
Data represents the mean and standard deviation of three biological replicates.
Data represents the mean of two technical replicates except (+)-JQ1.
Data represents the mean and standard deviation of six biological replicates.
Kd values were determined by KINOMEscan. Data represents the mean of two biological replicates.
