
Figure 1.
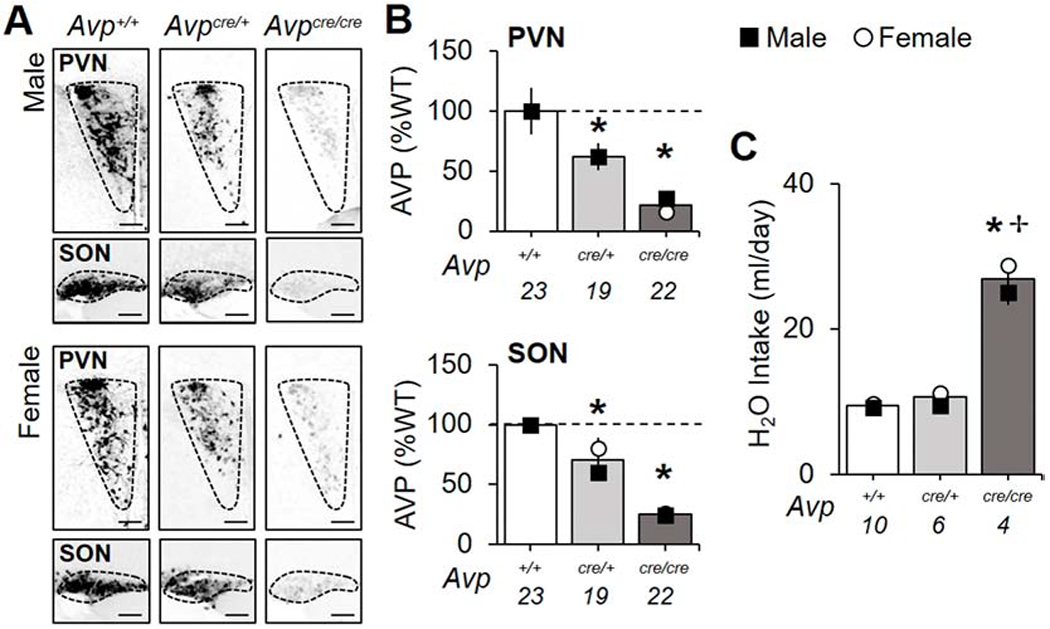
Decreased AVP and disrupted salt and water balance in Avpcre/cre mice. A. Representative images illustrating AVP levels in the PVN and SON. Scale bar = 100 μm. B. AVP is decreased in the PVN and SON of adult Avpcre/+ and Avpcre/cre mice (PVN-Genotype: F (2,63) = 23.67, p < 0.001, ηp2 = 0.46, Sex: F (1,63) = 0.17, p > 0.1, ηp2 = 0.003, Genotype*Sex: F (2,63) = 0.15, p > 0.8, ηp2 = 0.003; SON- Genotype: F (2,63) = 78.93, p < 0.001, ηp2 = 0.73, Sex: F (1,63) = 2.05, p > 0.1, ηp2 = 0.03, Genotype*Sex: F (2,63) = 1.56, p > 0.2, ηp2 = 0.05). For non-normalized values, see Table S1. C. Water consumption is elevated in Avpcre/cre mice (Genotype: F (2,19) = 202, p < 0.001, ηp2 = 0.97, Sex: F (1,19) = 7.26, p < 0.05, ηp2 = 0.34, Genotype*Sex: F (2,19) = 1.72, p > 0.2, ηp2 = 0.2). Numbers below abscissa represent sample size for each genotype, collapsed across sex (A-B: 9-12/sex; C:2-5/sex). Note: small error bars may be obscured by symbols and sex-specific symbols superimposed onto bar graphs may be obscured when female and male data overlap. Post hoc LSM Contrasts: * Differs from Avp+/+, genotype difference collapsed across sex, p < 0.05, ✢ Sex difference divided by genotype, p < 0.05.