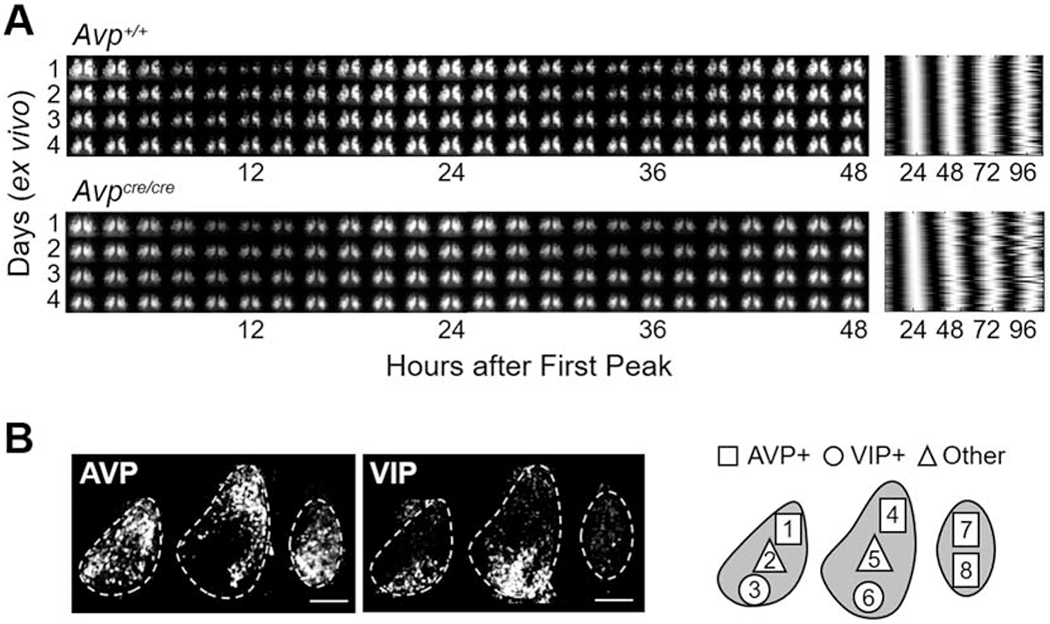
Figure 5.

PER2::LUC rhythms in SCN slices of Avp+/+ and Avpcre/cre mice. A. Representative double-plotted PER2::LUC bioluminescence images in 2 h bins (left) and raster plot illustrating cellular rhythms (right) for middle SCN slices collected from female Avp+/+ and Avpcre/cre mice. B. Representative images illustrating AVP- and VIP-immunoreactivity in PER2::LUC SCN slices. Scale bar = 100 μm. Spatial location of peptidergic regions used for analyses are AVP: 1, 4, 7, 8; VIP:3, 6; Other:2, 5.
