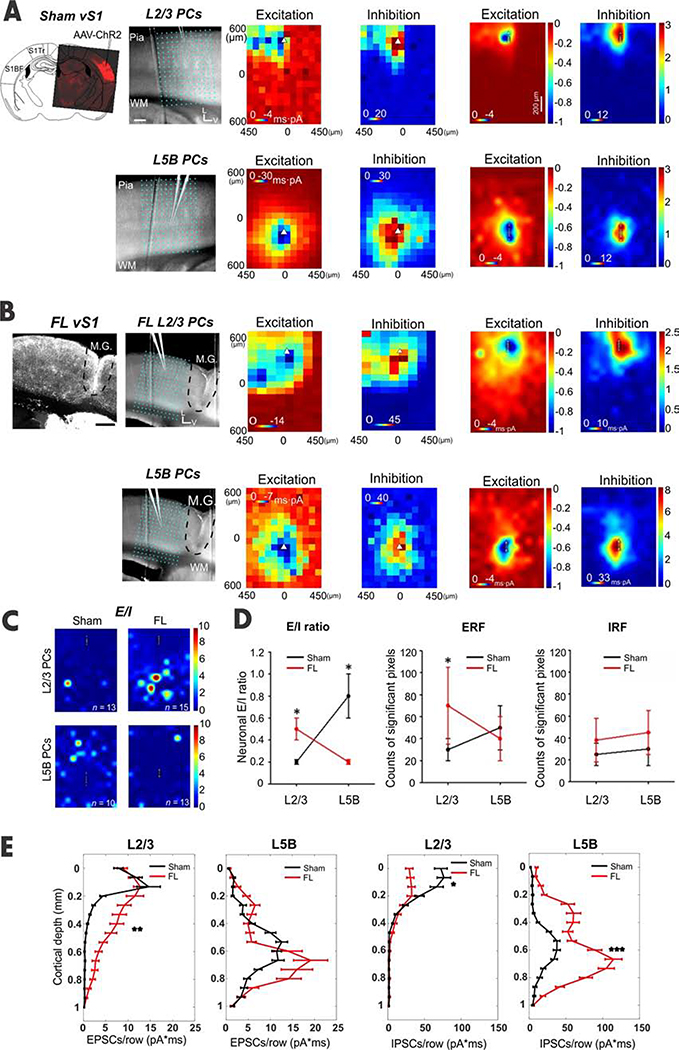
Figure 1. Aberrant synaptic inputs to superficial PCs in S1.
(A) CRACM of EPSCs and IPSCs in L2/3 and L5B PCs in sham mice. Top Left: confocal image of AAV-ChR2 virus expression pattern in vS1; Right: an overlay of a brain slice with a 16-by-12 photo-stimulation grid illustrates the photo-stimulation and recording sites for each group. Other panels: an example of CRACM maps of excitatory synaptic inputs (“Excitation”) and inhibitory synaptic inputs (“Inhibition”) in a L2/3 and L5B PC. Triangles indicate neuronal soma locations in this and in following panels and figures. Average excitation and inhibition maps to L2/3 and L5BPCs (neuron and mice numbers see C). Scale bar, 200 μm. (B) Similar to A-C but for FL treated mice. Note the excessive excitatory input to L2/3 PCs in FL mice (compare Excitation maps in A). (C) E/I heat maps obtained by calculating EPSC/IPSCS ratios in each of the 192 sites (16 X 12 pixels) in L2/3 (n=13 neurons for sham and n=15 for FL) and L5B PCs (n = 10 neurons for sham and n = 13 for FL) in sham (n=5 mice) vs. FL mice (n=5 mice). (D) E/I ratios were obtained by calculating the ratios of the summed EPSCs charges over summed IPSCs charges in heat maps. The E/I ratio in L2/3 PCs in the FL group was significantly larger than the ratio in the sham group (unpaired t-test, P=0.027); meanwhile, the E/I ratio in FL L5B PCs was significantly reduced compared to that in sham counterparts (unpaired t-test, P=0.012). Excitatory receptive field (ERF), obtained by counting significant EPSC pixels (>2X s.d.) in each group. The ERF in sham L2/3 PCs was significantly higher in the FL group than in their counterparts in the sham group (unpaired t-test, P=0.037); the ERF in L5B PCs was similar across groups (unpaired t-test, P = 0.83). Inhibitory receptive field (IRF), obtained by counting significant IPSC pixels in each group. No significant IRF change was found in both L2/3 and L5B PCs across groups (unpaired t-test, P=0.71 for L2/3 and P=0.63 for L5B). (E) Laminar distribution of average charges or strength of EPSCs and IPSCs for L2/3 and L5B PCs from sham (black) and FL (red) mice. For L2/3 PCs, the EPSCs charge was significantly increased in the FL group (unpaired t-test, P=0.0013). In contrast, L5B EPSCs charge in the FL group was similar to that seen in the sham group (unpaired t-test, P=0.134). However, for the IPSCs charge, the layer specific difference was roughly reversed between FL and sham groups (L5B, unpaired t-test, P=0.000; L2/3, P=0.044).
See also Figures S1 and S2.

