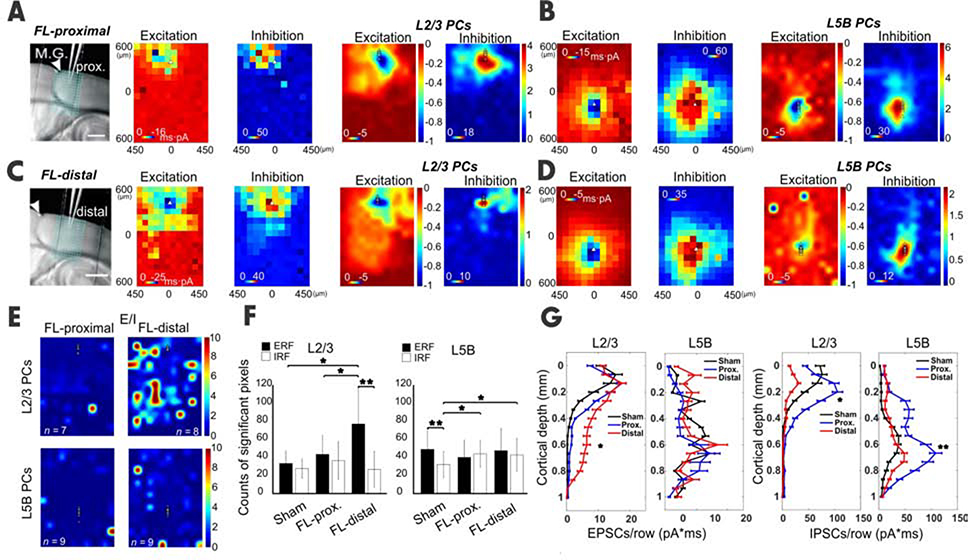
Figure 3. Site- and layer-specific synaptic inputs measured by CRACM.
(A-B) CRACM of local vS1 excitatory and inhibitory synaptic inputs to L2/3 or L5B PCs in a region proximal to the M.G. The layout is similar to Figure 1. (C-D) Same as above but for the FL-distal region. The excitatory input to distal L2/3 PCs was more extensive compared to its proximal counterpart, particularly in infragranular layers (compare Excitation maps in A,C, also F); meanwhile the inhibitory input to distal L2/3 PCs was much smaller compared to its proximal counterpart (compare Inhibition maps in A,C, also F). (E) E/I heat maps in L2/3 (n=7 neurons for FL-proximal and n = 9 for FL-distal, 4 mice) and L5B PCs (n=8 neurons for sham and n=9 for FL, 4 mice). (F) Comparison of ERF and IRF between groups, obtained by counting total significant pixels in A-D. Note the L2/3 ERF in FL-distal was significantly increased when compared to sham and FL-proximal (unpaired t-test, P < 0.05); While in L5B, the IRF of both FL-proximal and FL-distal increased significantly (unpaired t-test, P < 0.05). (G) Laminal distribution of charge of EPSCs and IPSCs for L2/3 and L5B PCs in sham (black) vs. FL-proximal (blue) and FL-distal (red) groups. G, L2/3 EPSCs strength in FL-distal group was significantly larger for infragranular layers compared to that in the FL-proximal group (P = 0.032). No difference was found in EPSCs charge across layers between groups. L2/3 IPSCs charge was significantly lower in FL-distal group compared to that in FL-proximal group (P<0.05), mainly in supragranular layers. L5B IPSCs strength was significantly lower in FL-distal group compared to that in FL-distal group (paired t-test, P=0.013), but mainly in infragranular layers. See also Figure S4.

