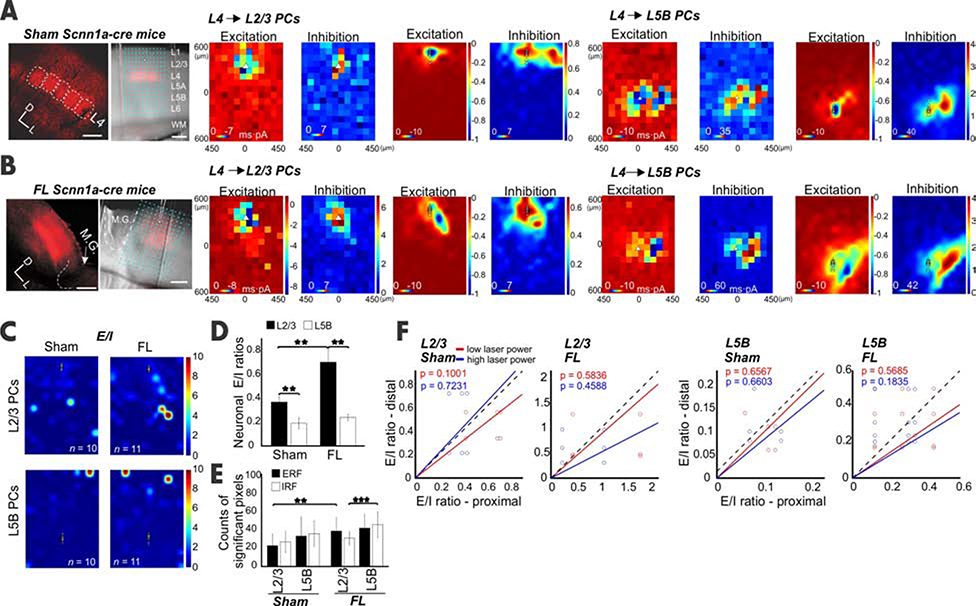
Figure 4. Input from the granular layer contributes to the E/I imbalance in epileptic mice.
(A) Left, confocal image showed the barrels in vS1 expressing ChR2 from a sham Scnn1a-cre mouse. Right, an exemplar recording from a L2/3 PC. Scale bar, 200 μm. CRACM of synaptic input from L4 to L2/3 PCs or to L5B PCs in sham mice. Note the scale difference in Inhibition maps between two layers. (B) Same as A but for FL mice. The pixel number of inputs to L5B PCs for both Excitation and Inhibition increased (F). (C) E/I heat maps for L2/3 (Sham, n=10, FL, n=11) and L5B PCs (Sham, n = 11, FL, n = 11). (D) The averaged E/I ratios across neurons in FL were significantly higher in L2/3 PCs (P=0.023) but not in L5B PCs. (E) The ERF size in FL was also significantly higher in L2/3 (P=0.007); in contrast, the IRF, instead of ERF, increased significantly in L5B (P=0.000), but not L2/3. (F) No significant E/I ratio differences were observed between proximal and distal locations from L4 to L2/3 or L5B PCs in both sham and FL groups. The relationship between E/I ratios in sham vs FL mice did not change under two different laser intensities. See also Figure S5.

