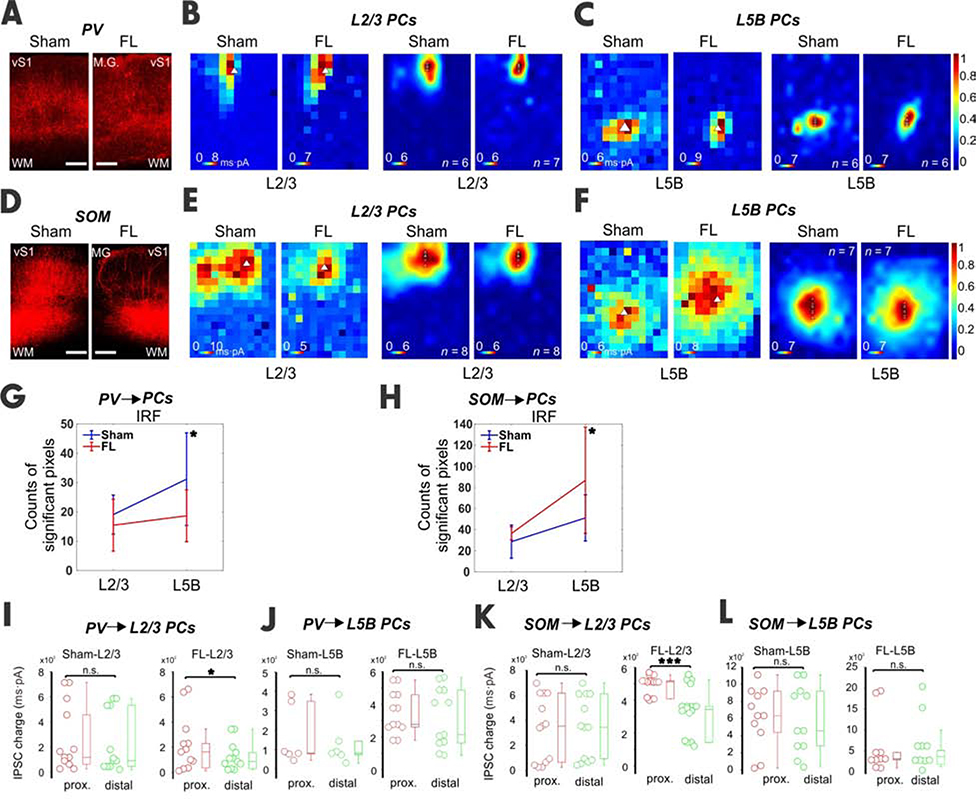
Figure 5. Inhibitory inputs from PVs and SOMs to PCs of vS1 in epileptic mice.
(A) Confocal images showed ChR2 expression in PVs for both sham and FL slices. (B) An example of and averaged heat maps showed the inhibitory input from PVs to L2/3 PCs. (C) An example of and averaged heat maps showing the inhibitory input from PVs to a L5B PC. (D-F) Similar to above but for SOMs. (G) The IRF in L5B was significantly reduced in the FL group (sham, n=6, 3 mice; FL, n=6, paired t test, DF=5, 3 mice P=0.04). (H) Similar to G but for SOMs. IRF in L5B was also significantly increased in the FL group (sham, n=7; FL, n=7, unpaired t test, DF=6, P=0.014). (I) In sham L2/3 PCs, no difference between proximal and distal groups was found in IPSC charge from PVs. In FL mice L2/3 PCs, IPSC charge from PV INs was reduced in the distal group (P<0.05). (J) In both the sham and FL L5B PCs, no difference between proximal and distal groups was found in IPSC charge from PVs. (K-L) Similar to I-J but for SOMs. Note the significant difference in IPSC charge between proximal and distal groups for FL L2/3 PCs (P=0.000). See also Table S1.

