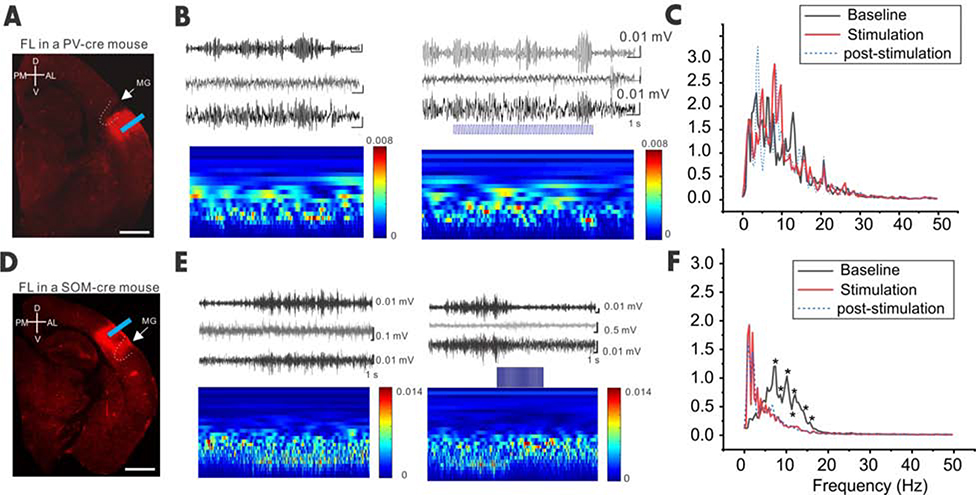
Figure 6. Closed-loop optogenetic activation of SOM but not PVs terminated the spontaneous SWD in vivo.
(A) Confocal image showing ChR2 expression in a FL PV-cre mouse. (B) EEG traces (top) and time frequency plot (continuous wavelet transformation of the same EEG traces) show SWD before, during and after optogenetic stimulation (5Hz) in the perimicrogyri area. (C) Power spectrum of the baseline, optogenetic stimulation, and post-stimulation period (2 seconds in each period, n=8 mice, p=0.67595, Stim. vs. baseline, DF=127). (D-F) Same as A-C but for SOM-cre mice. Note that the power was significantly reduced at the frequency ranging from 7–15 Hz upon optical stimulation compared to baseline (n=5 mice, p=0.03078, Stim. vs. baseline as one group, DF= 127, * denotes specific frequencies for P values <0.05).

