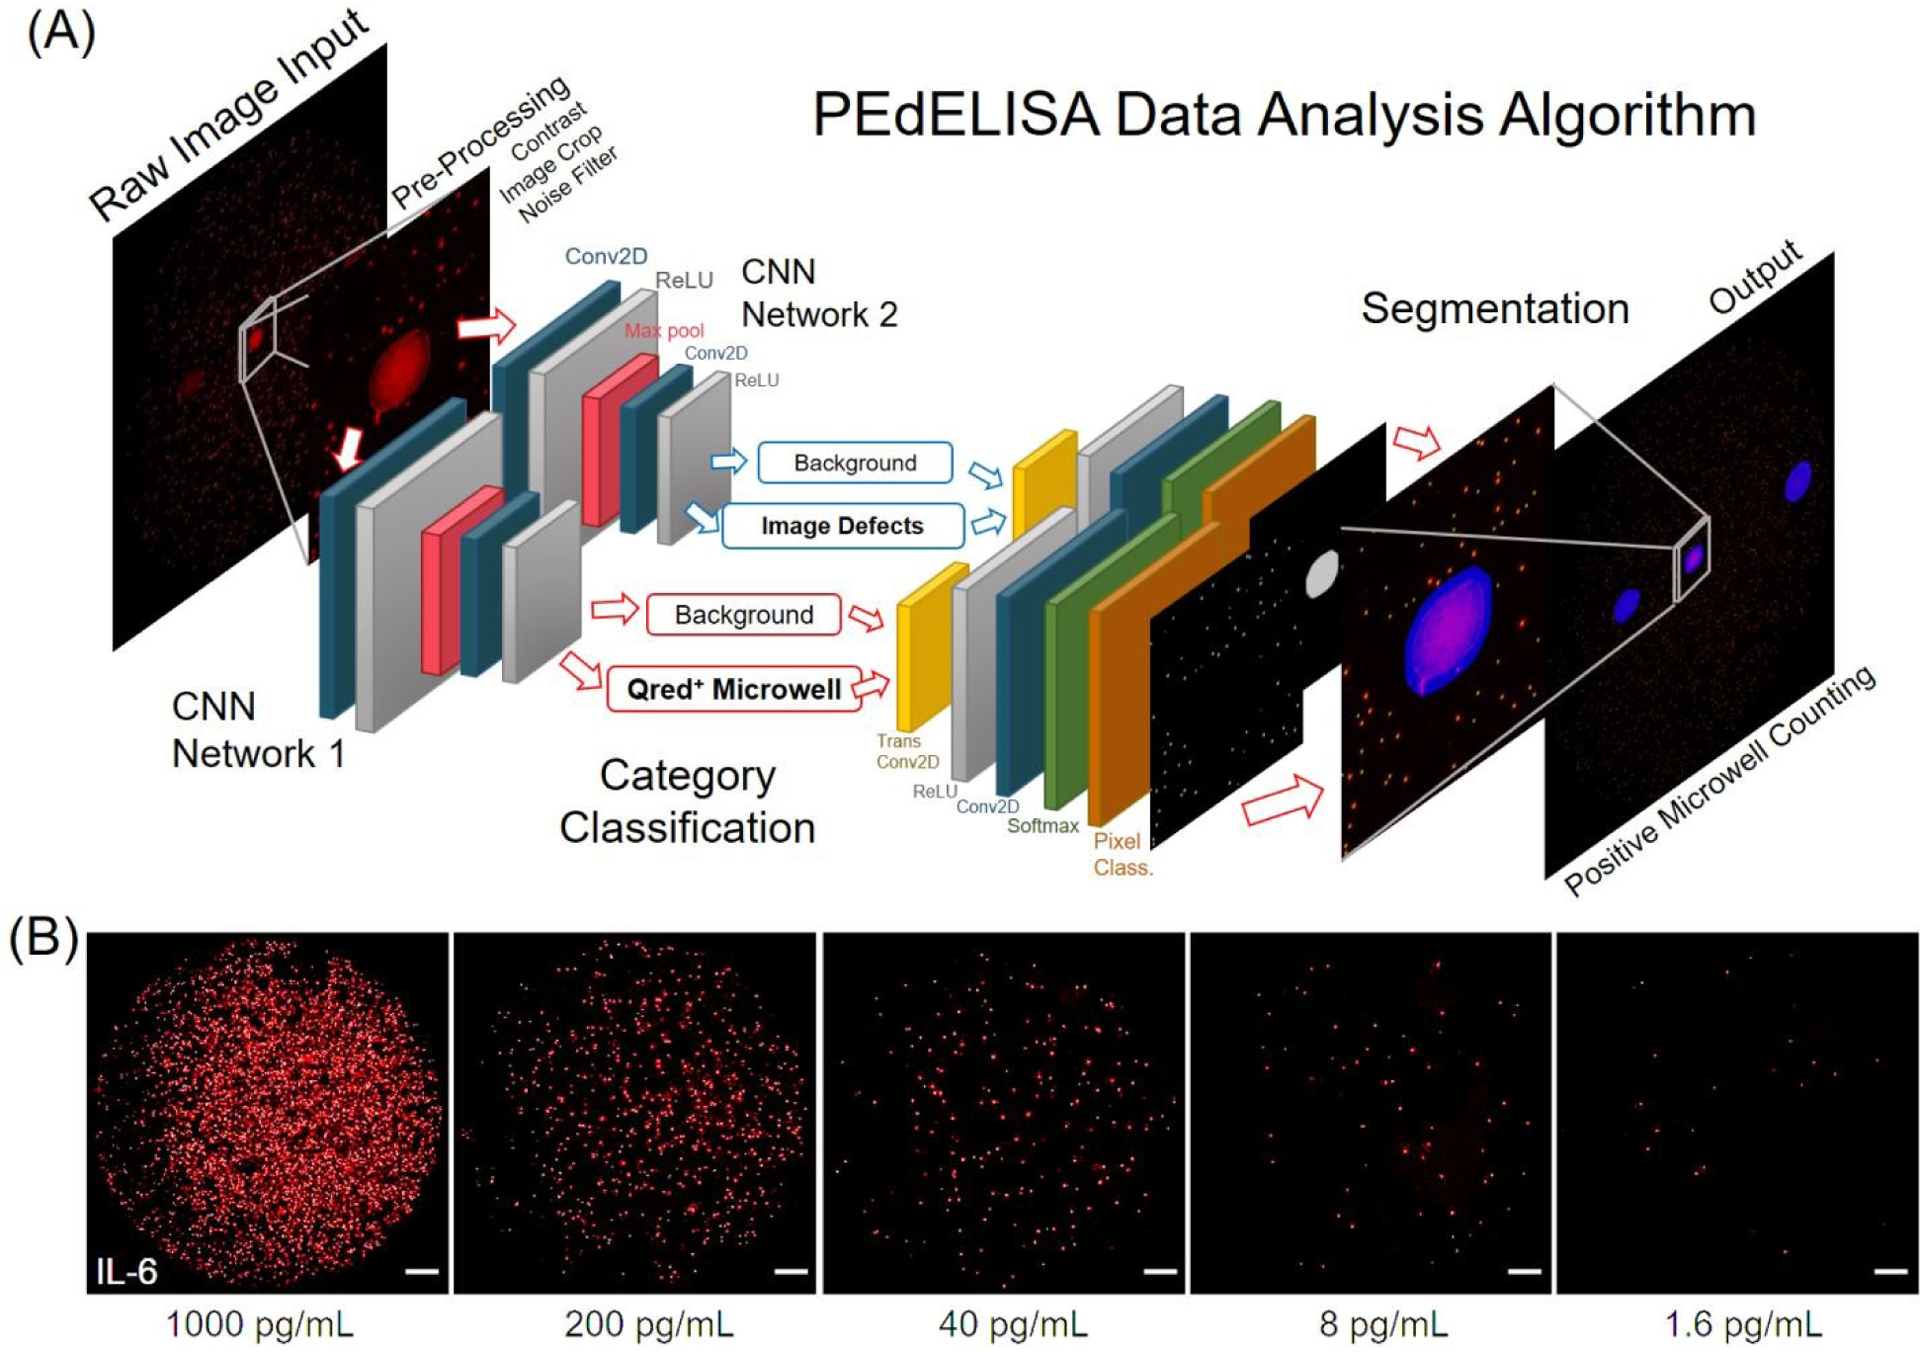
Figure 2.

(A) Architecture of the PEdELISA data analysis algorithm using convolutional neural network (CNN) and parallel computing by MATLAB. Two CNN networks were trained and executed in parallel to read in the QuantaRedTM (Qred) fluorescence mirowell images, and sequentially performed image pre-processing (including image cropping, contrast enhancement, and noise filtering), category classification, image segmentation, and post-processing (image overlay, visualization, defect compensation, microwell counting). (B) Representative snapshot images of enzyme active “On” microwells on a biosensing pattern (66,724 wells/biosensor) for various analyte concentrations of IL-6. For clear visualization, images of 3600×3600 pixels were cropped from original raw images of 6000×4000 pixels with 80% brightness enhancement and 80% contrast enhancement. All of the scale bars are 200 μm. See Fig. S4 for images taken for IL-1β, TNF-α, IL-10, and IL-6.
