
Figure 4.
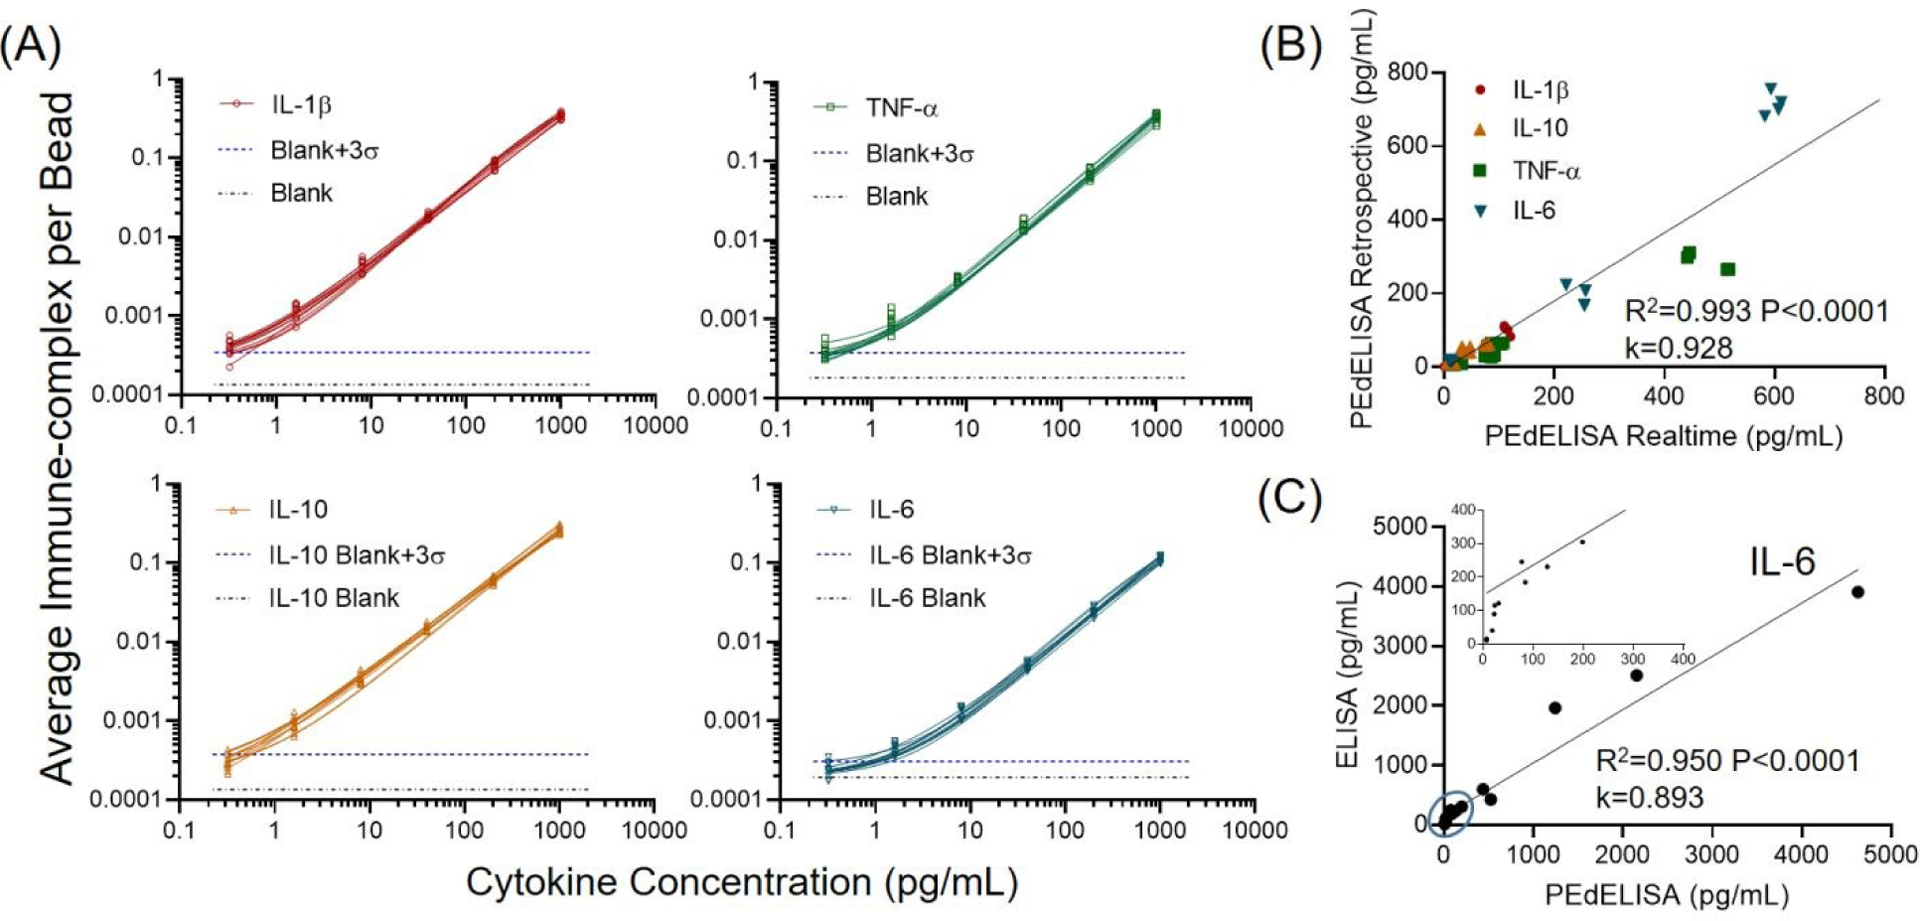
(A) Daily COVID-19 patient assay standard curves for four cytokines from 0.32 pg/mL to 1000 pg/mL in FBS (10 curves for each cytokine obtained over 10 workdays). The data points were fitted with four-parameter logistic (4PL) curves. The black dotted line represents the signal level from a blank solution. The blue dotted line shows 3σ above the blank signal, which is used to estimate the limit of detection (LOD) for each cytokine. (B) Linear correlation (R2=0.99, P<0.0001) between rapid measurements of fresh samples and retrospective measurements of samples stored for more than 30 days (1 freeze-and-thaw at −80 °C) in quadruplicate for 5 representative COVID-19 patients. (C) Good agreement was observed between single-plex IL-6 ELISA (R2=0.95, P<0.0001) and multiplex PEdELISA measurements for 15 COVID-19 patients. The inset shows the circled region and k is the slope of the linear regression for (B)-(C).