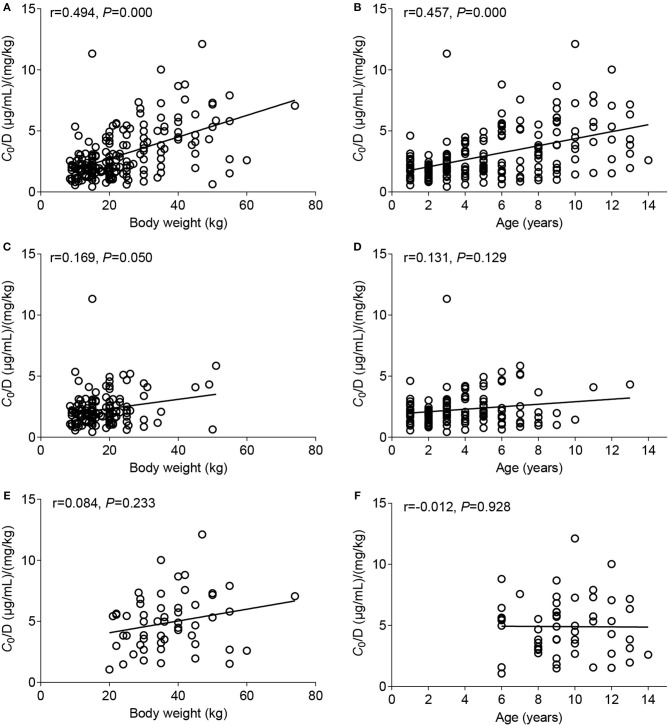
Figure 2.
Correlation between the C0/D ratio and body weight (BW) (left column) or age (right column). (A,B) Data from patients who took the VPA oral solution and patients who were administered the VPA SR tablets were combined, (C,D) analysis of data from patients who took the VPA oral solution, and (E,F) analysis of data from patients who took VPA SR tablets.

