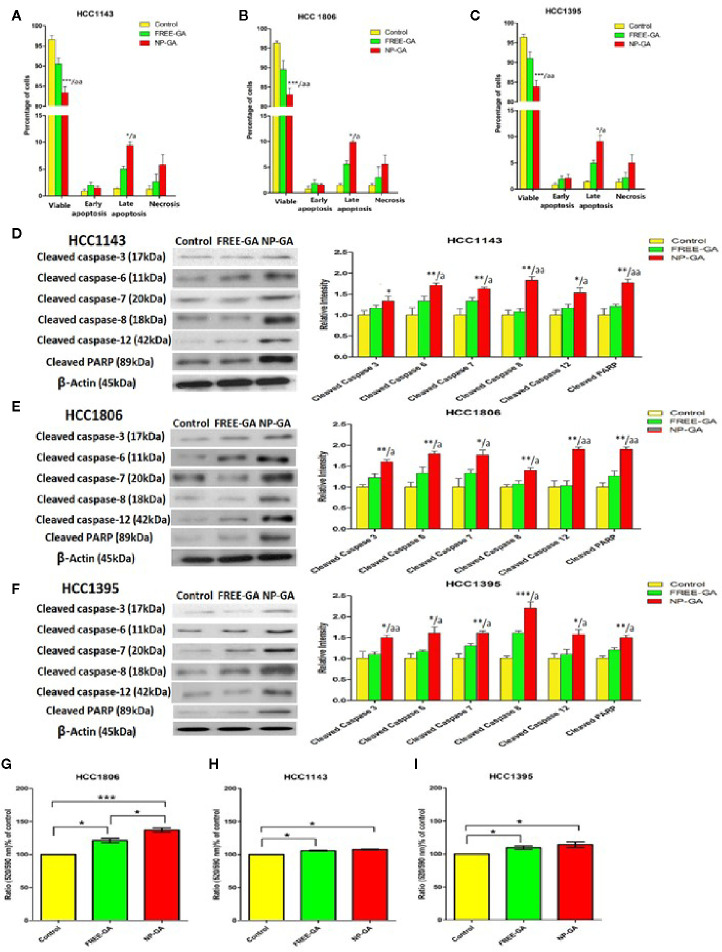
Figure 3.
The percentages of the viable, early apoptotic, late apoptotic, and necrotic TNBC cells after free-GA and NP-GA treatments for 3 hours. Apoptosis and necrosis in (A) HCC1143, (B) HCC1806, and (C) HCC1395 cells after free-GA or GA-loaded FA-Arg-PEUU-NP (NP-GA) treatment for 3h. Cleaved caspase protein expressions in (D) HCC1143, (E) HCC1806, and (F) HCC1395 cells after free-GA or GA-loaded FA-Arg-PEUU-NP (NP-GA) treatment for 3h. Left panel: Western blot showing the protein expressions of cleaved caspase-3, cleaved caspase-6, cleaved caspase-7, cleaved caspase-8, cleaved caspase-12, and cleaved PARP. Right panel: the quantitative analysis of the corresponding protein expressions. The data are shown as the means ± SEM, n = 3, *p < 0.05, **p < 0.01, ***p < 0.001 compared to control group; a < 0.05, aa < 0.01 compared to free GA group. Changes in mitochondrial membrane potential (MMP) in (G) HCC1806, (H) HCC1143, and (I) HCC1395 cells after free-GA or GA-NP treatment for 3h. The y-axis is the ratio of green fluorescent signal (520nm) to red fluorescent signal (590nm). An increase in 520/590nm ratio indicates the collapse of MMP. The data are shown as the means ± SEM, n = 3, *p < 0.05, **p < 0.01, ***p < 0.001 as indicated.

