Figure 5.
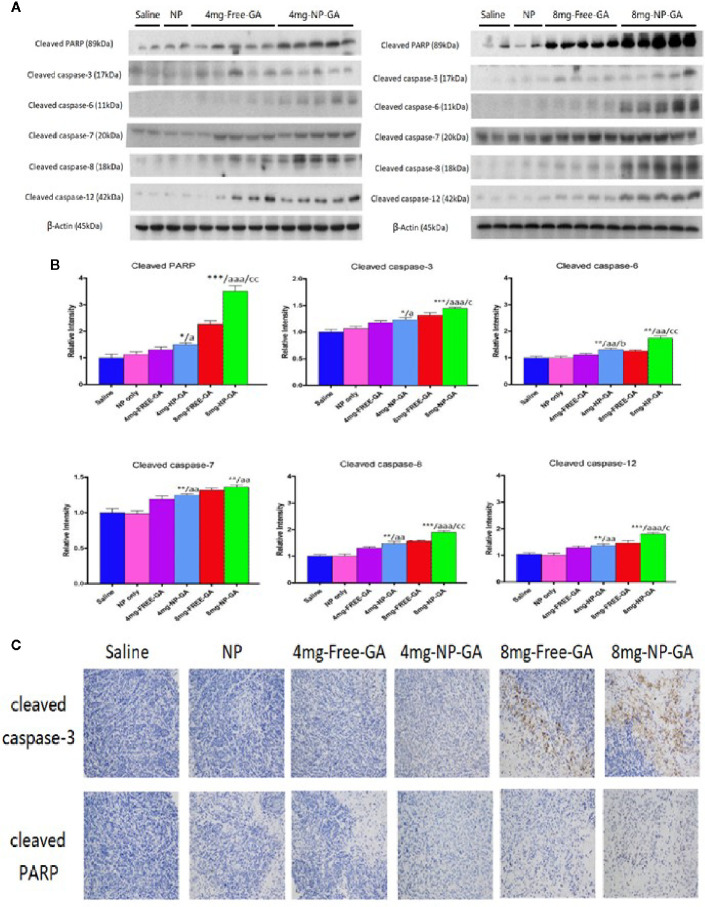
In vivo apoptotic protein expressions in the xenograft tissues of the HCC1806-bearing xenograft mouse models after saline, FA-Arg-PEUU-NP (NP), free GA, or GA-loaded FA-Arg-PEUU-NP (NP-GA) treatments. (A) Western blot showing the protein expressions of cleaved caspase-3, cleaved caspase-6, cleaved caspase-7, cleaved caspase-8, cleaved caspase-12, and cleaved PARP in the xenograft tissues and (B) quantitative analysis of the corresponding protein expressions. The data are shown as the means ± SEM, n = 4-5 mice in each group. *p < 0.05, **p < 0.01, ***p < 0.001 compared to saline group; a < 0.05, aa < 0.01, aaa < 0.001 compared to NP group; b < 0.05 compared to 4mg-free-GA group; c < 0.05, cc < 0.01 compared to 8mg-free-GA group. (C) Representative pictures showing the immunohistochemistry (IHC) staining of the cleaved capase-3 and cleaved PARP in the xenograft tissues in these mice.

