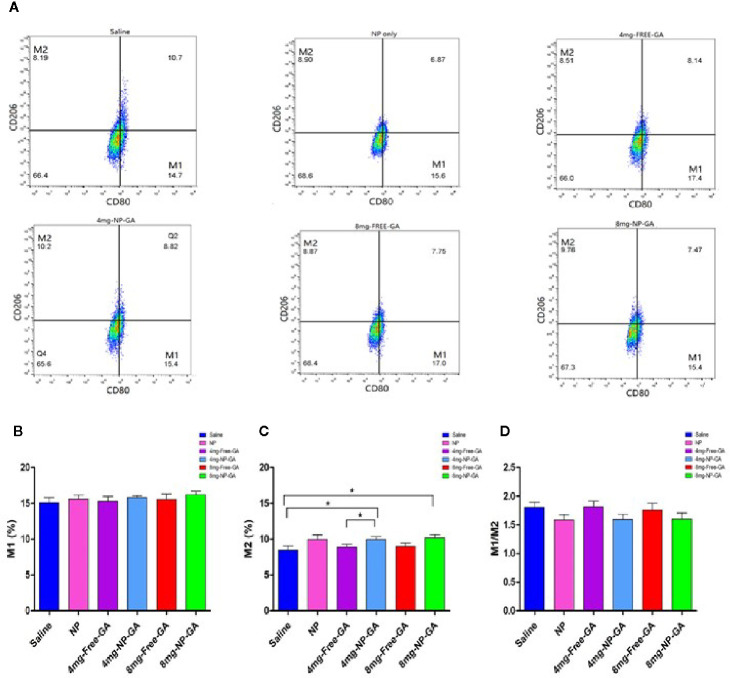
Figure 8.
Polarization of tumor-associated macrophage (TAM) of the HCC1806-bearing xenograft mouse models after saline, FA-Arg-PEUU-NP (NP), free GA, or GA-loaded FA-Arg-PEUU-NP (NP-GA) treatments. (A) The polarization of the tumor-associated macrophages (TAM) of the HCC1806-bearing xenograft mouse models after the saline, FA-Arg-PEUU-NP (NP), free GA, or GA-loaded FA-Arg-PEUU-NP (NP-GA) treatments. The percentages of the (B) M1 phenotype, (C) M2 phenotype, and (D) M1/M2 ratio of the TAM. The data are shown as the means ± SEM, n = 5 mice in each group. *p < 0.05 as indicated.

