
Figure 4.
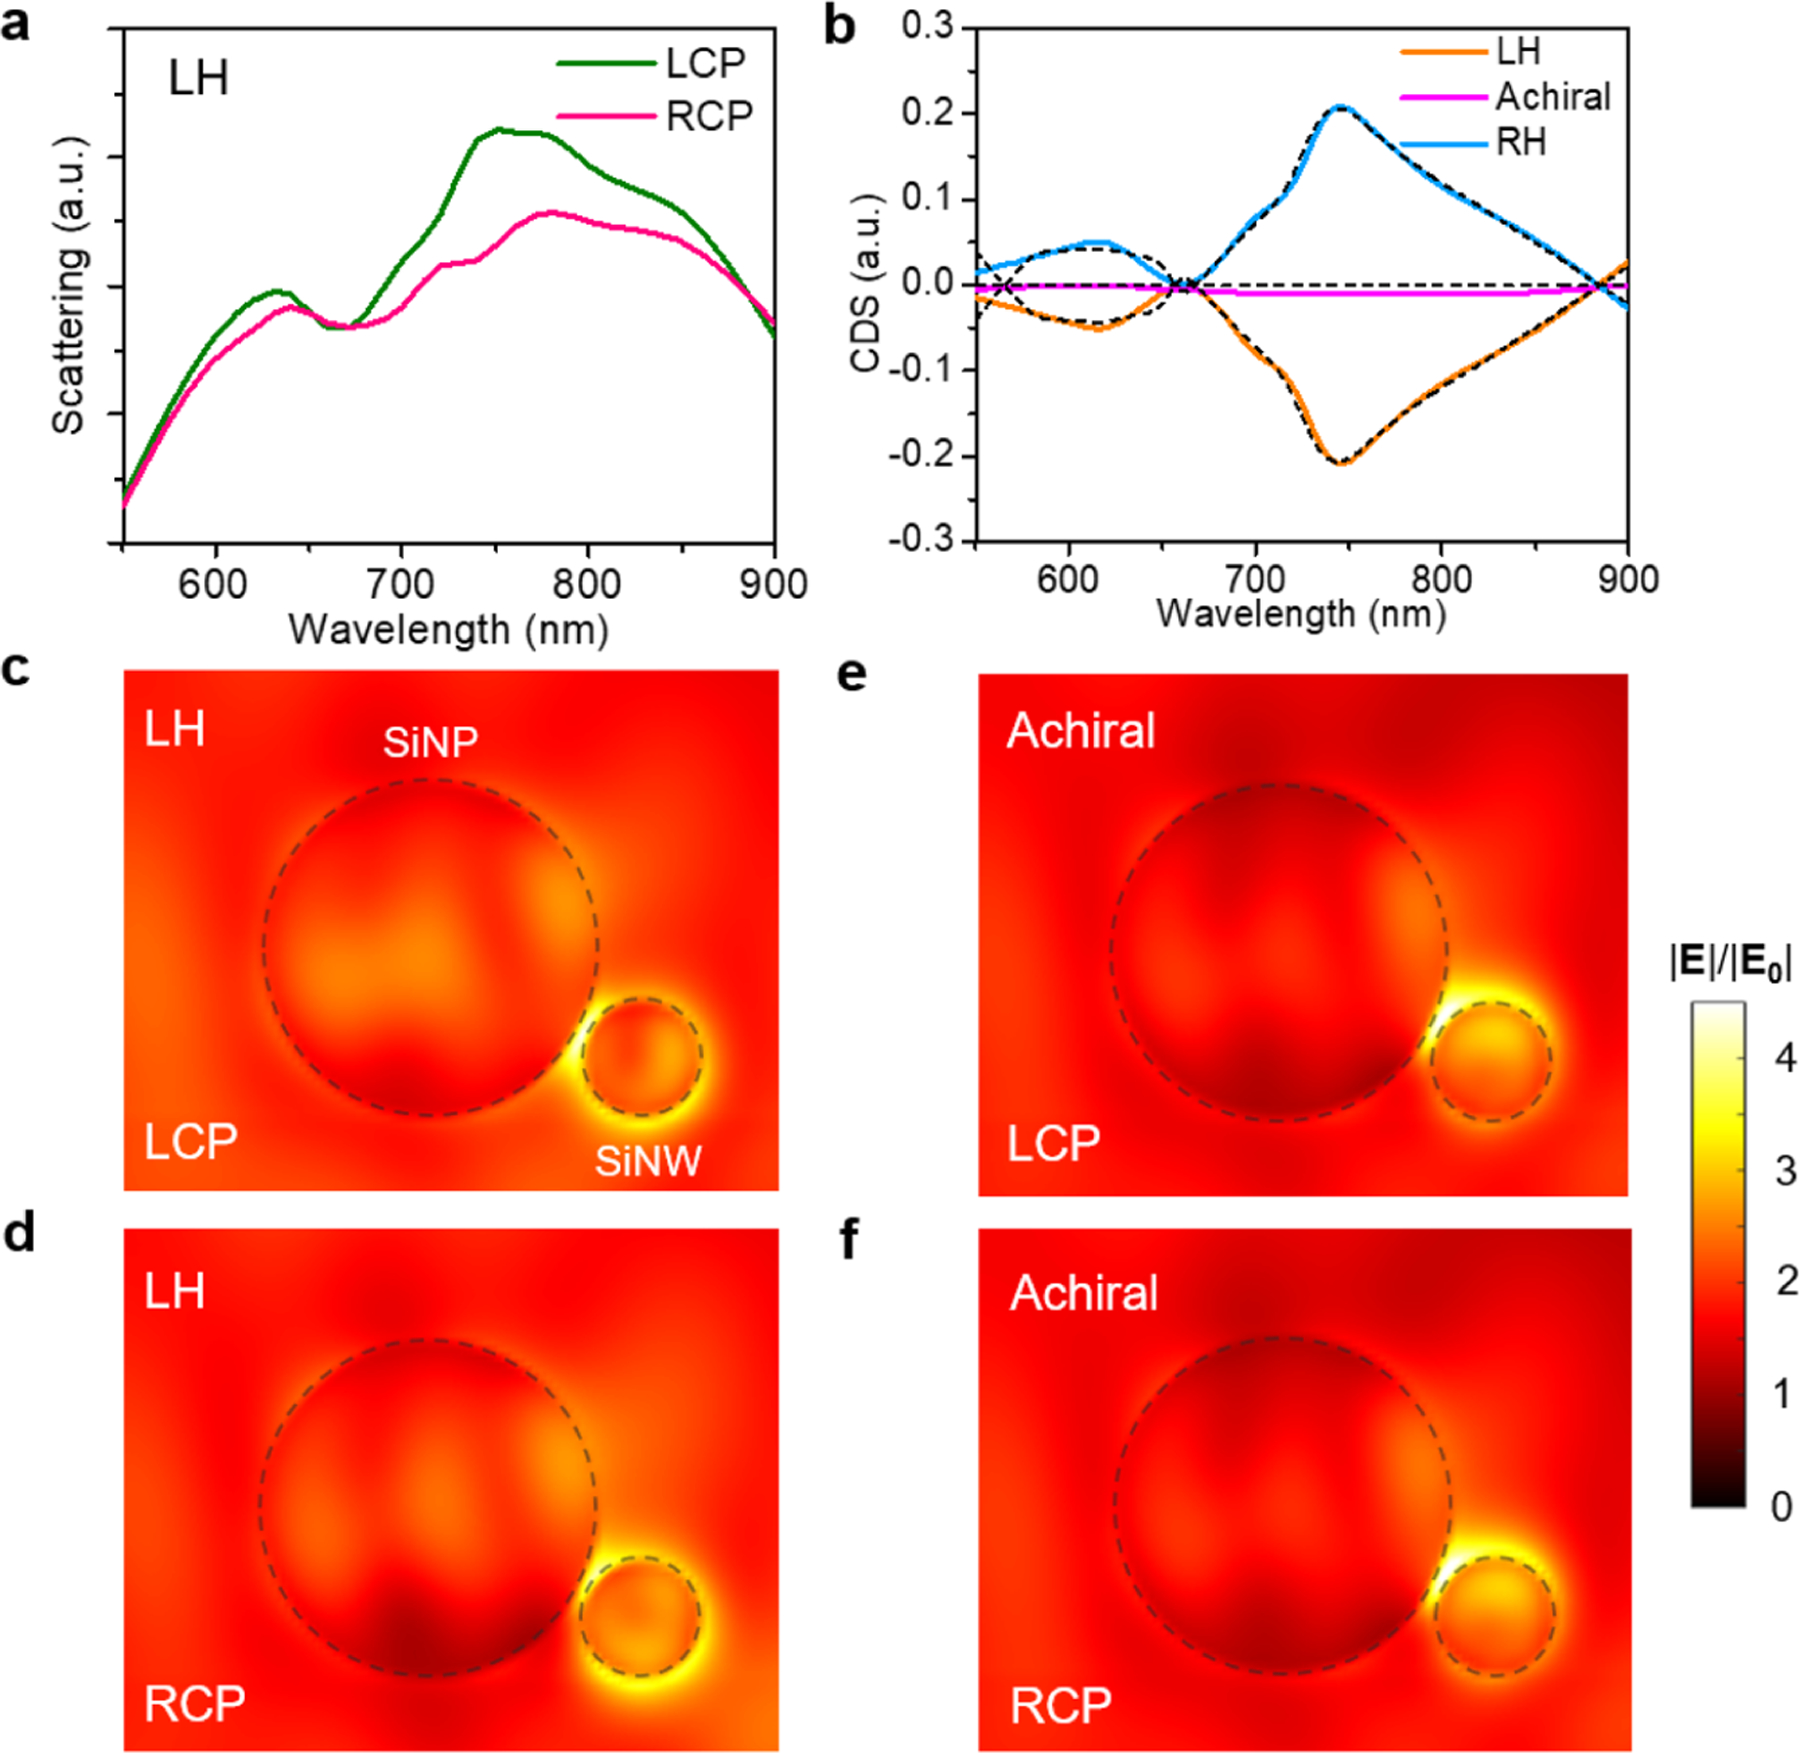
FDTD simulation and coupled-mode theory analysis. (a) Simulated scattering spectra of the LH structure under LCP and RCP illumination. (b) Simulated CDS spectra of LH, achiral, and RH structures. The black dashed lines are the fitting curves via the coupled-mode theory. (c,d) The electric field distributions in the LH structure at 740 nm induced by LCP (c) and RCP (d) incidence. (e,f) The electric field distributions in achiral structure at 740 nm induced by LCP (e) and RCP (f) incidence. All electric field distributions are cut at the cross-sectional plane of the SiNW passing through the center of the SiNP.