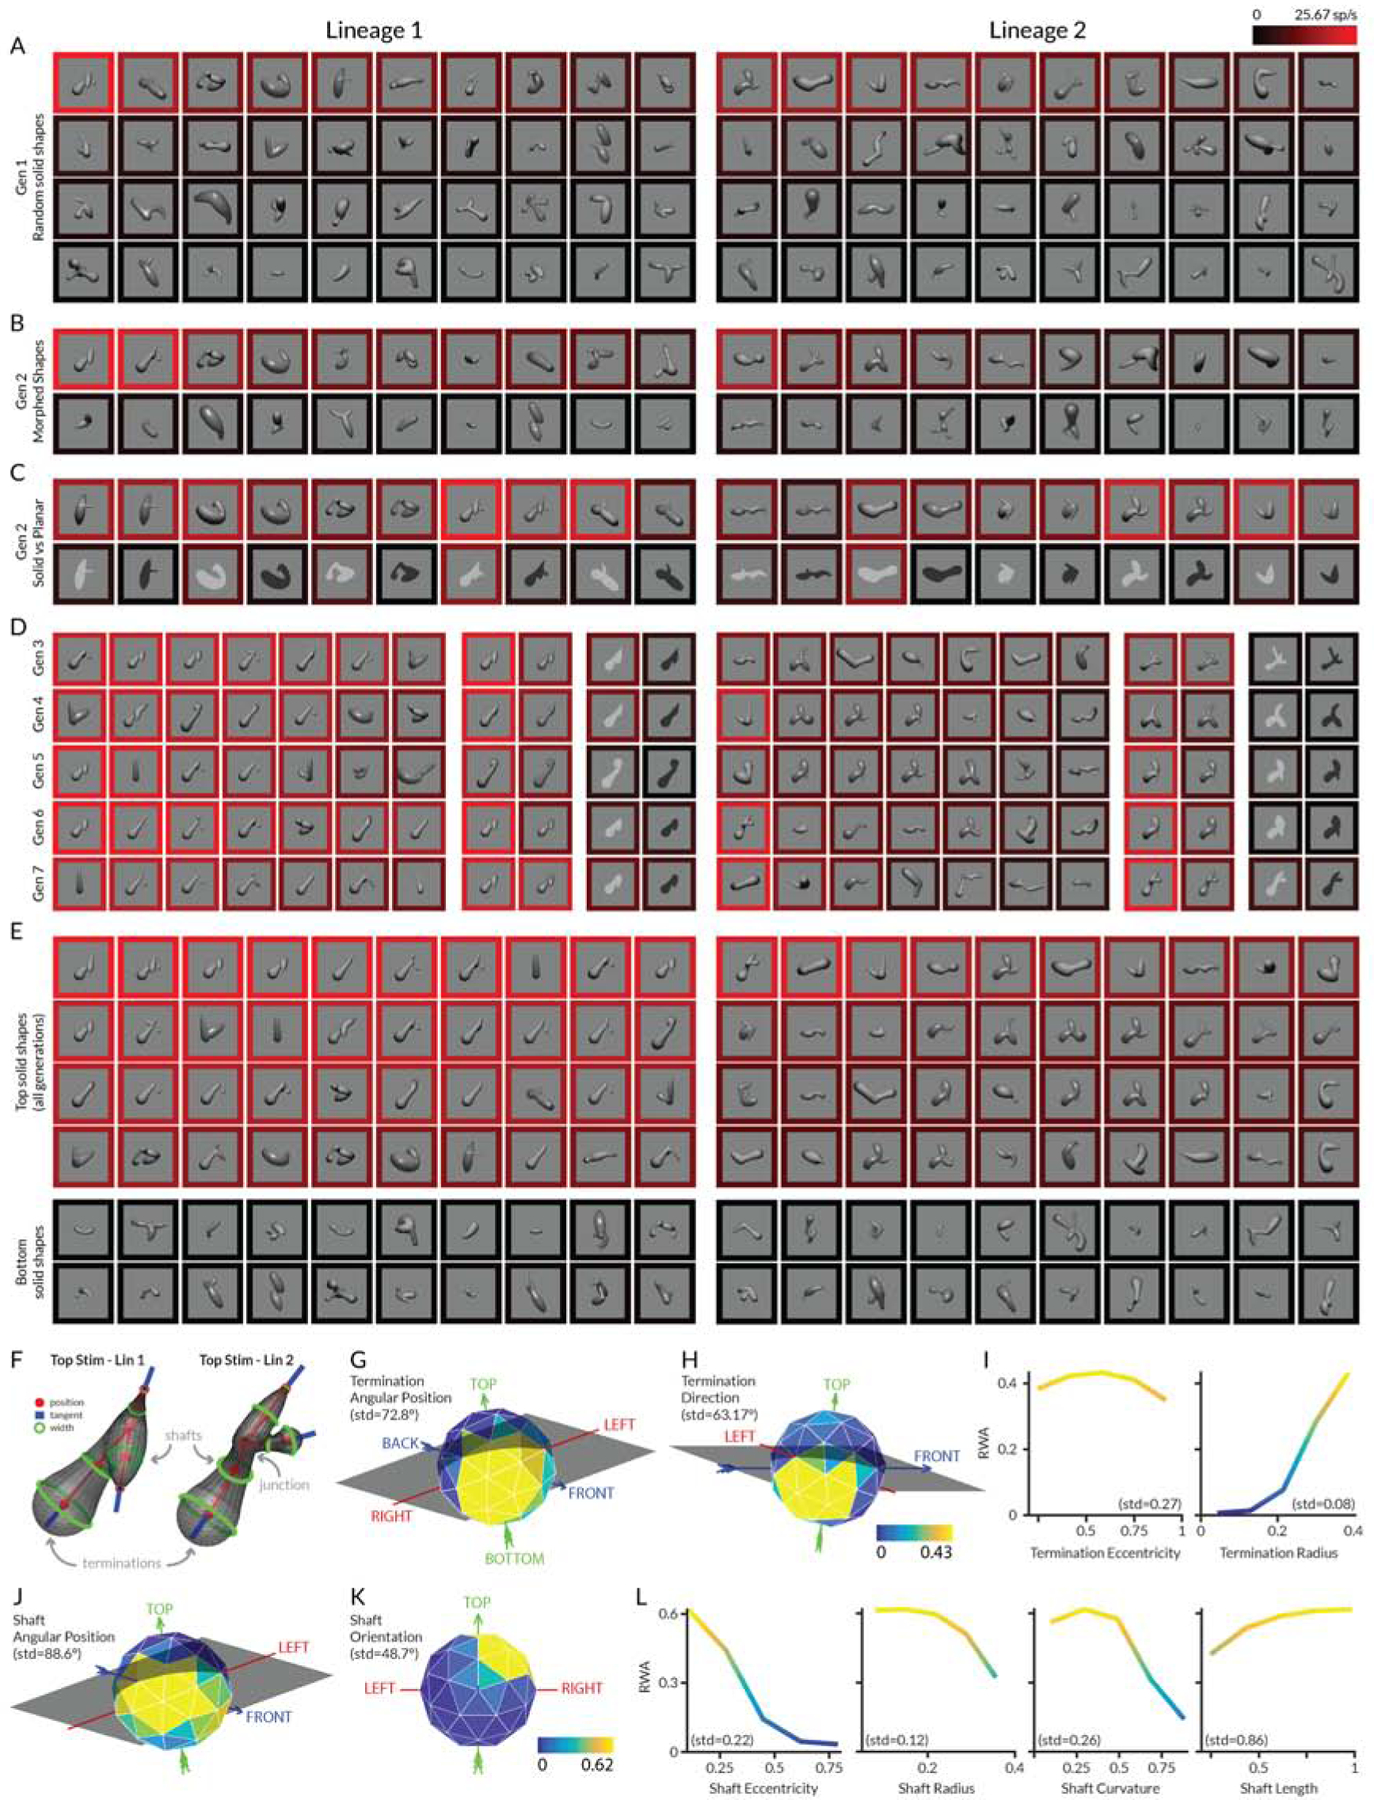
Figure 1. Area V4 encodes solid shape information—introductory example.

(A) First generation (Gen 1) of 40 random stimuli per lineage. Each stimulus was rendered with a lighting model based on either a matte or polished surface illuminated by an infinite distance point source from the viewer’s direction. Stimuli were centered on and sized to fit within the previously mapped receptive field of an individual V4 neuron and flashed in random order for 750 ms each (interleaved with 250 ms blank periods), against a uniform gray background, while the monkey performed a fixation task. The response rate for each stimulus was calculated as the average number of spikes/s across the 750 ms presentation periods and across 5 repetitions of each stimulus. The neuron’s average response to each stimulus is represented by the color of the surrounding border, referenced to the scale at the upper right, with bright red corresponding to 26 spikes/s. Stimuli in each block are ordered by descending response strength from the upper left to the lower right. (B) Half of Gen 2 comprised partially morphed descendants of ancestor stimuli from Gen 1 plus additional random stimuli. (C) The other half of Gen 2 comprised tests of high response Gen 1 stimuli rendered as solid vs. flat shapes. (D) Highest response stimuli and example solid/flat comparisons in Gen 3–7. (E) Highest and lowest response stimuli across all generations. (F) Parameterization of shaft, junction, and termination shape. (G–L) Response weighted average (RWA) analysis of response strength. Each panel shows average normalized response strength as a function of geometric dimensions used to describe shaft or termination shape. Each plot represents a slice through the RWA at the location of the overall RWA peak across all dimensions (rather than a collapsed average across the other dimensions). Spherical (object-centered position and termination direction) and hemispherical dimensions (shaft orientation) are shown as spherical polygons, in some cases tilted and rotated to reveal the tuning peak. The arrows and labels (LEFT, RIGHT, TOP, BOTTOM, BACK, FRONT) indicate the original directions in the stimulus from the monkey’s point of view. Normalized response strength is indexed to a color scale for shafts (below K) and a color scale for terminations (below H). Color is a redundant cue for response strength in the Cartesian plots. See also Figure S1.
