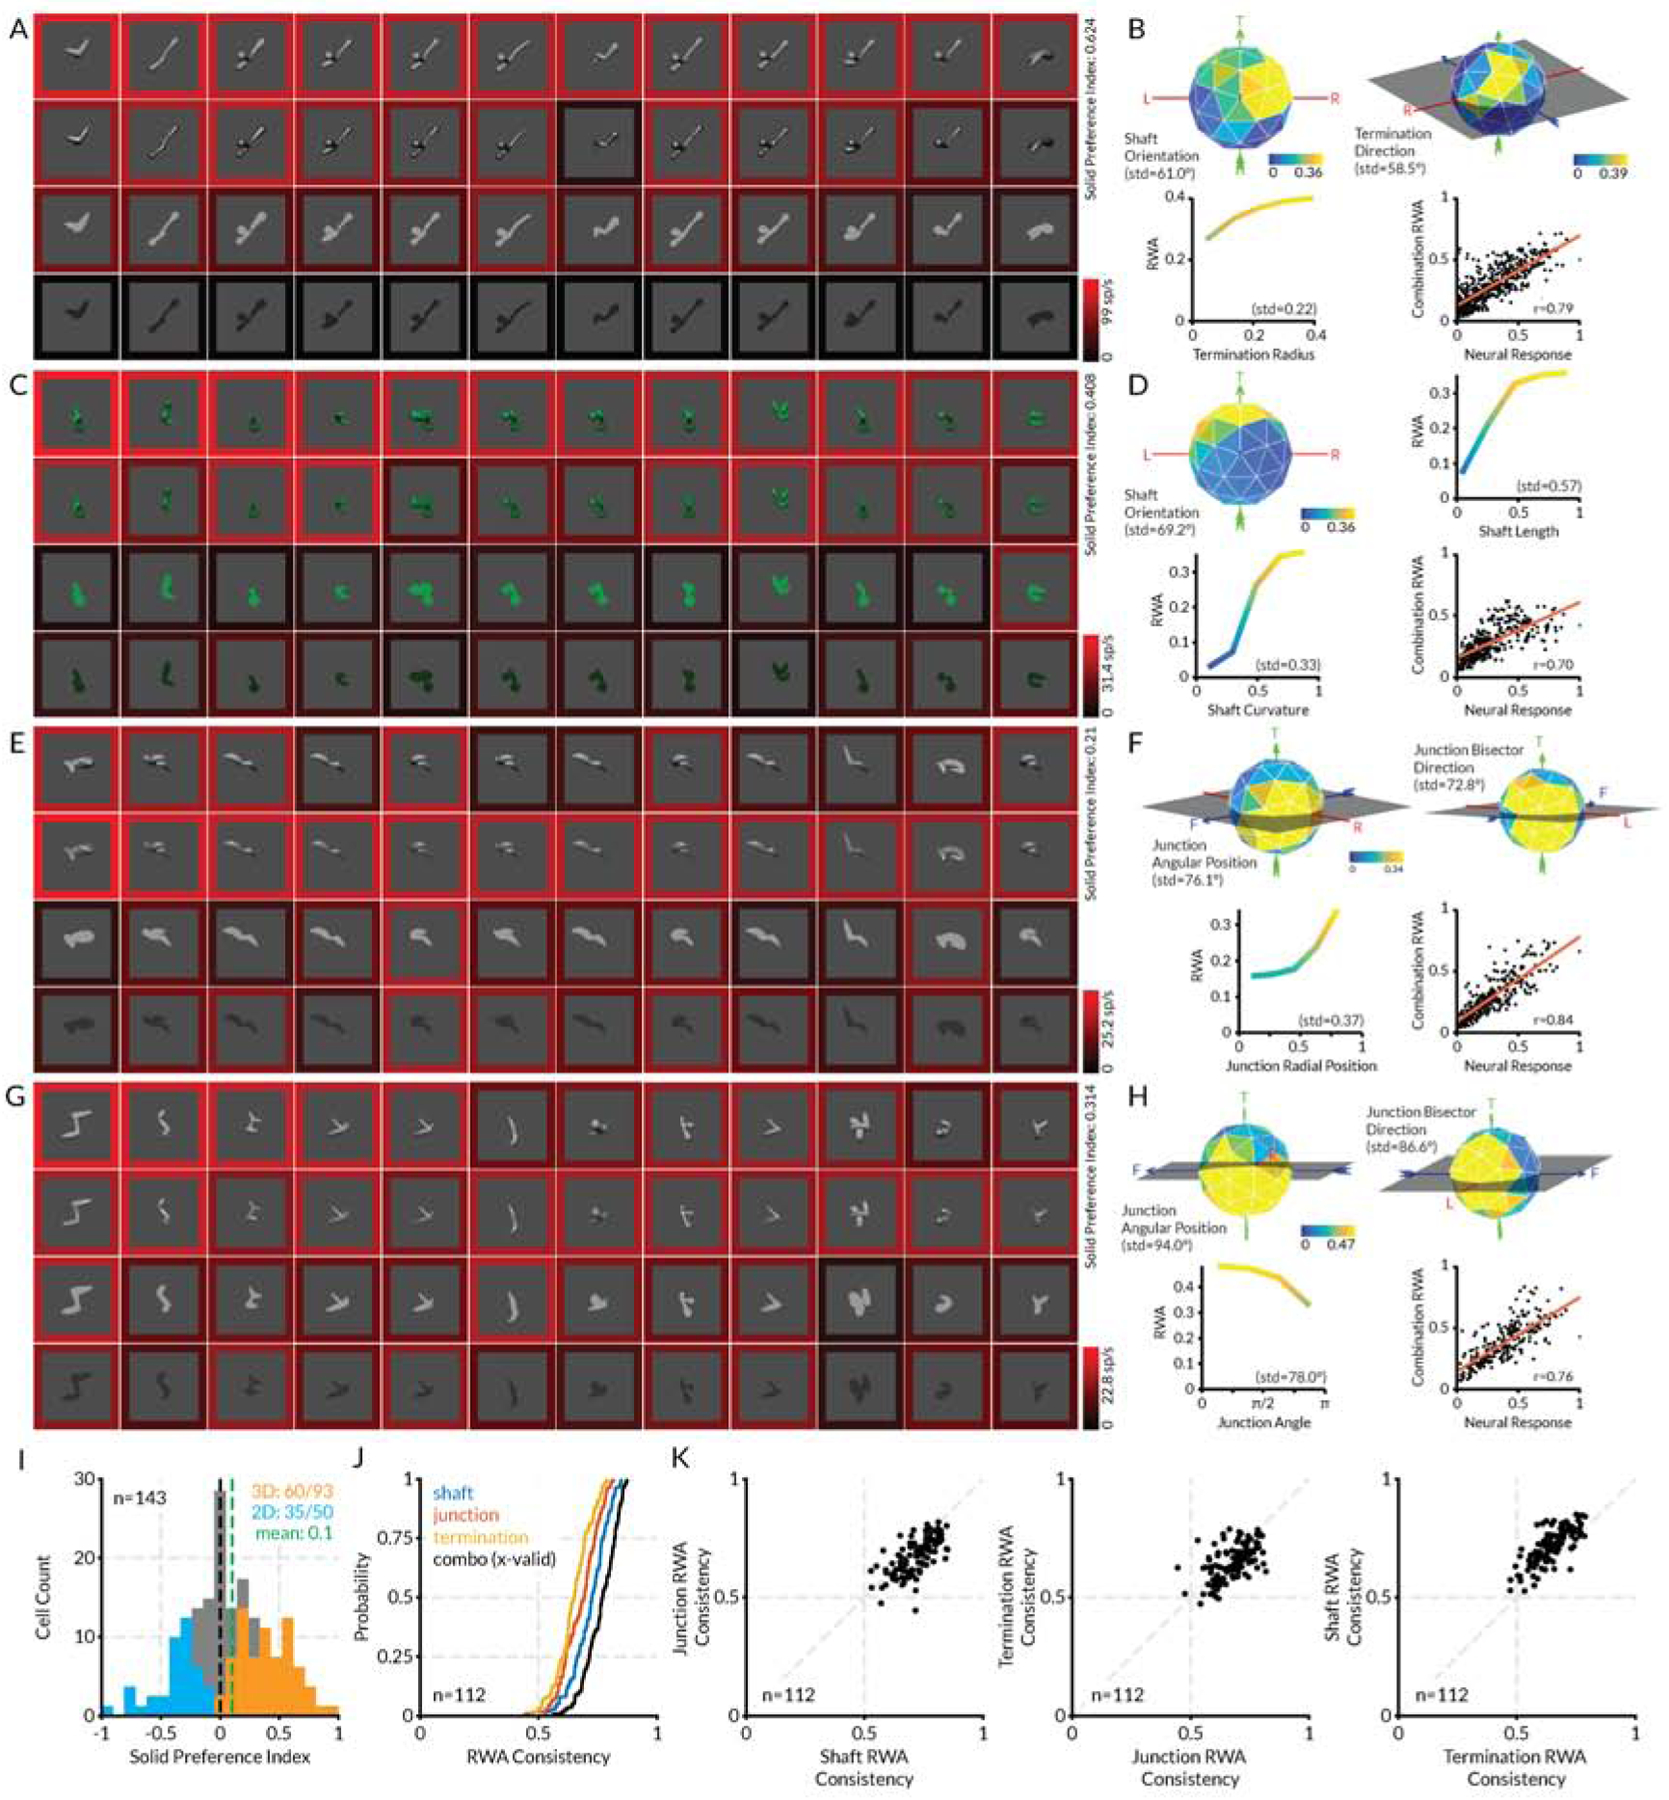
Figure 2. Area V4 encodes solid shape information—additional examples.

(A) Highest response stimuli (columns) for the first example neuron, tested in four rendering conditions (rows). Scale bar at bottom right indexes the border color representation of average neural response to each stimulus. (B) Plots of RWA strength for this neuron, selected to highlight dimensions with strongest tuning, plus a scatterplot of RWA responses vs. observed responses. (C–H) Plots for the three other example neurons. Details as in (a) and (b). (I) Histogram distribution of solid shape preference index (SP). Values significantly greater or less than 0 (t-test, two-tailed, p < 0.05) are plotted in orange and blue, respectively. (J) Cumulative distributions of RWA/observed correlations for shaft, junction, and termination RWAs. (K) Comparisons of prediction accuracies for shaft, junction, and termination RWAs. See also Figure S2.
