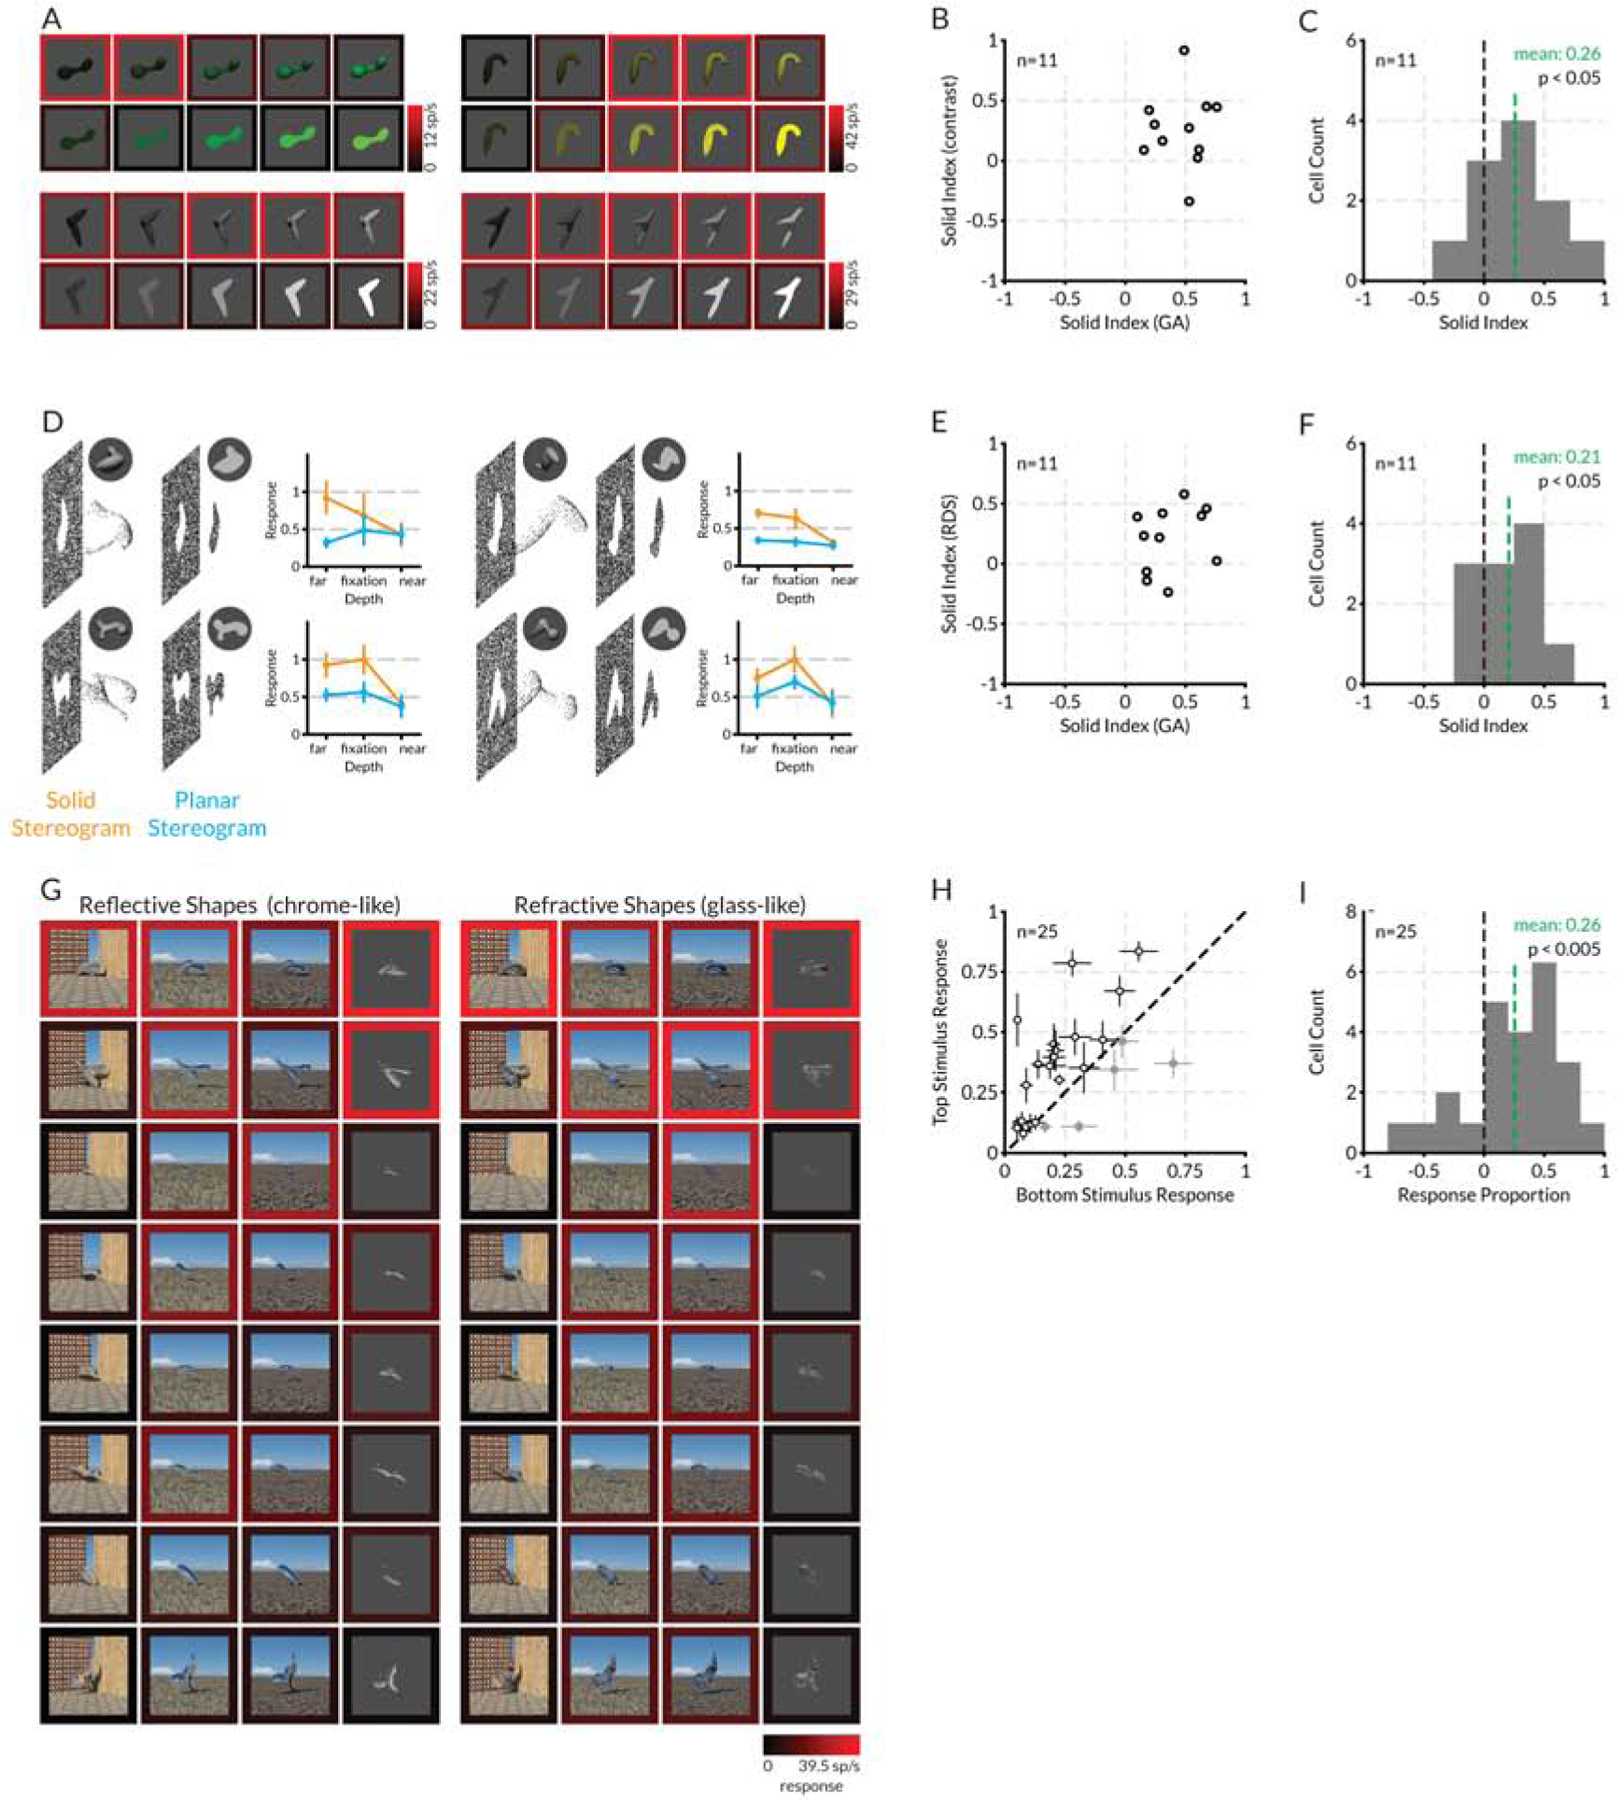
Figure 4. V4 solid shape coding generalizes across different image cues.

(A) Comparison of solid and flat stimulus responses across a range of figure/background contrasts, for four example solid-preferring V4 neurons. In each case, responses to solid stimuli, within an optimum contrast range, were stronger, as shown by the brighter red surrounds (indexed to the color scale bars on the bottom right of each plot). (B) Scatterplot of solid preference values for 11 neurons with significantly positive solid preference values in the genetic algorithm dataset (randomization t-test, two-tailed, p < 0,05), tested across contrasts as in (A). (C) Histogram of solid preference values for the same 11 neurons. The mean solid preference value for these neurons in the genetic algorithm was 0.46 and this was significantly greater than 0 (t-test, two- tailed, p <0.001). The mean solid preference value in the contrast test, based on averaging responses across the full contrast ranges, was 0.26 and this was significantly greater than 0 (t-test, two-tailed, p < 0.05). (D) Diagrams and normalized response plots for four example V4 neurons, comparing responses to solid vs. planar random dot stereogram versions of high response stimuli from the genetic algorithm experiment, presented at three stereoscopic depths relative to the fixation plane. Bars indicate standard error of the mean across 5 repetitions. (E) Scatterplot of solid preference values for 11 neurons with significantly positive solid preference values in the genetic algorithm dataset (randomization t-test, two-tailed, p < 0,05), tested with solid and planar stereograms as in (D). (F) Histogram of solid preference values for the same 11 neurons. The mean solid preference value for these neurons in the genetic algorithm was 0.37 and this was significantly greater than 0 (t-test, two-tailed, p <0.001). The mean solid preference value in the random dot stereogram test, based on averaging responses across depths, was 0.21 and this was significantly greater than 0 (t-test, two-tailed, p < 0.05). (G) Responses of a single example solid-preferring V4 neuron to 8 stimuli (rows, in descending order of response strength in the original genetic algorithm dataset) in four chrome-like renderings and four glass-like renderings (columns). Response levels are indicated by border color, indexed to the scale bar at lower right. (H) Scatterplot of average responses of 25 neurons tested in the same way, to the top vs. bottom genetic algorithm stimuli, averaged across the refraction and reflection rendering conditions (e.g., the top and bottom rows in (C)). (I) Histogram of response proportion index values for the same 25 neurons. The RP mean across the 25 neurons was 0.26 and this was significantly greater than 0 (t-test, two-tailed, p < 0.005). See also Figure S3.
