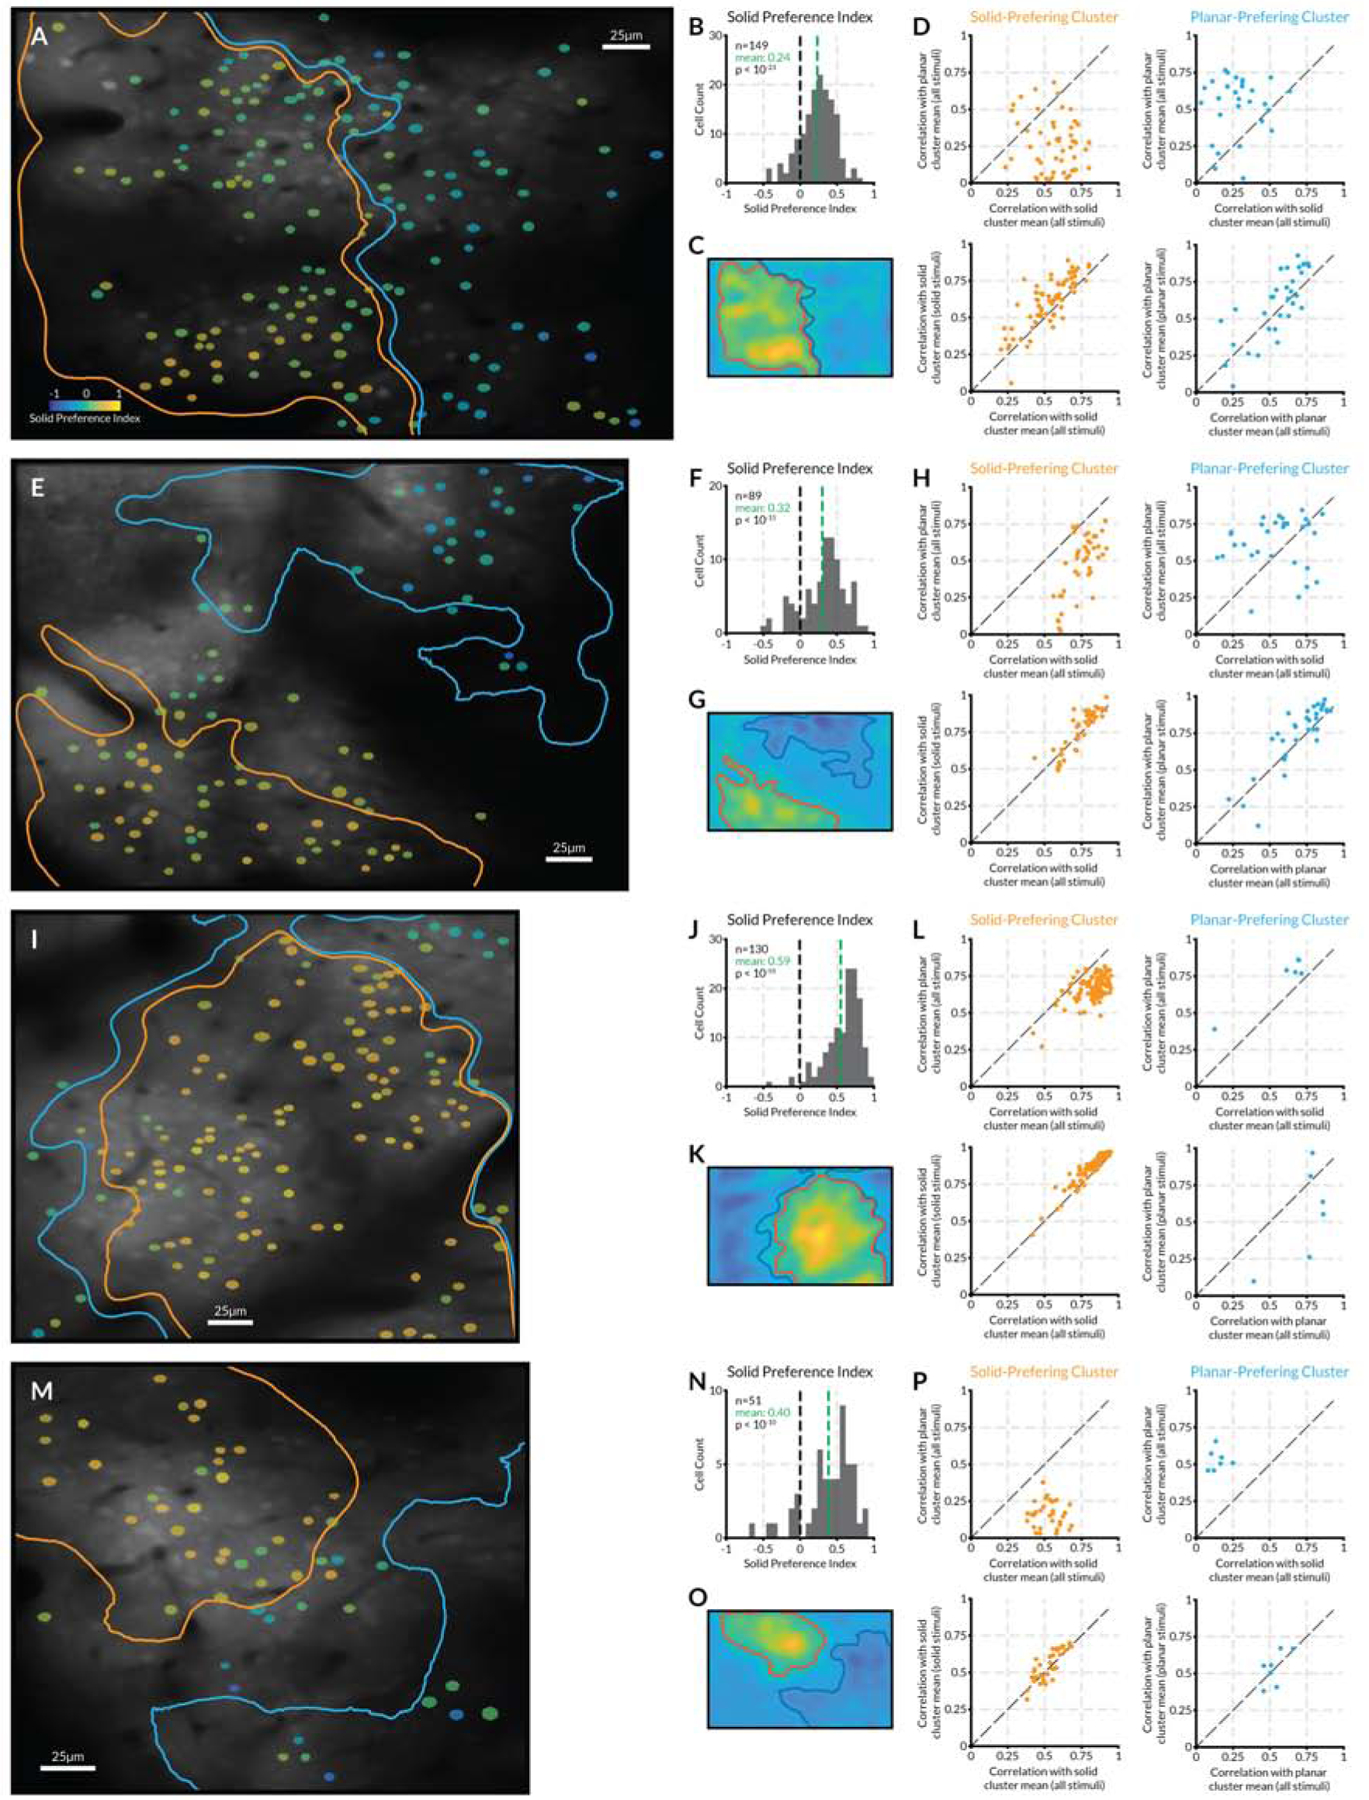
Figure 6. Area V4 micro-organization includes flat and solid shape modules—additional examples.

(A–D, E–H, I–L) Three imaging regions studied with flashing stimuli (Figure S4), as in Figure 5. Details as in Figure 5. (M–P) Imaging region studied with drifting stimuli (Figure S5). These data leave open questions about distribution of cluster sizes across larger surface regions, relationship of clusters to organization for other tuning dimensions in V4, and depth profiles of clusters, which would require electrophysiology to measure.
