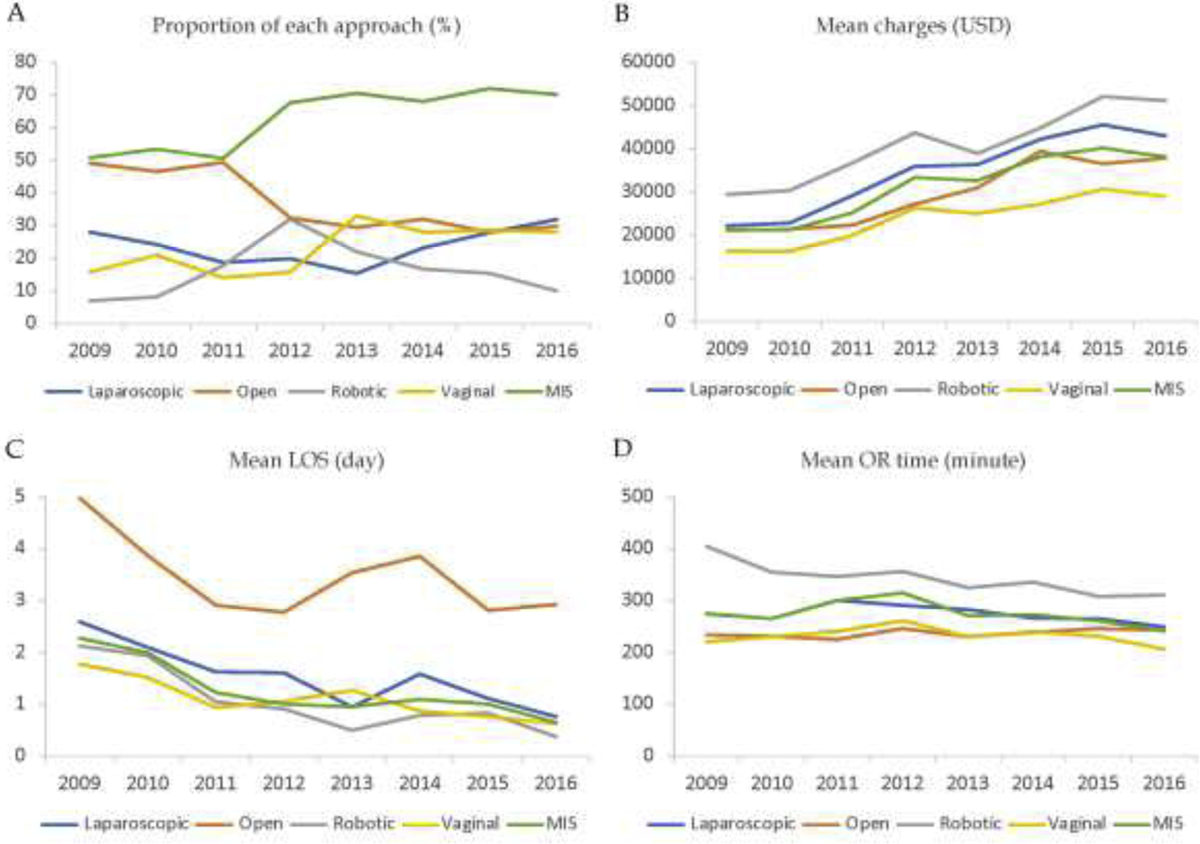
Figure 1.

A. Proportion of hysterectomies per approach per fiscal year. B. Mean total charges per approach per fiscal year. All charges were adjusted for inflation to 2009 U.S. Dollars. C. Mean length of stay per approach per fiscal year. D. Mean OR time per approach per fiscal year.
