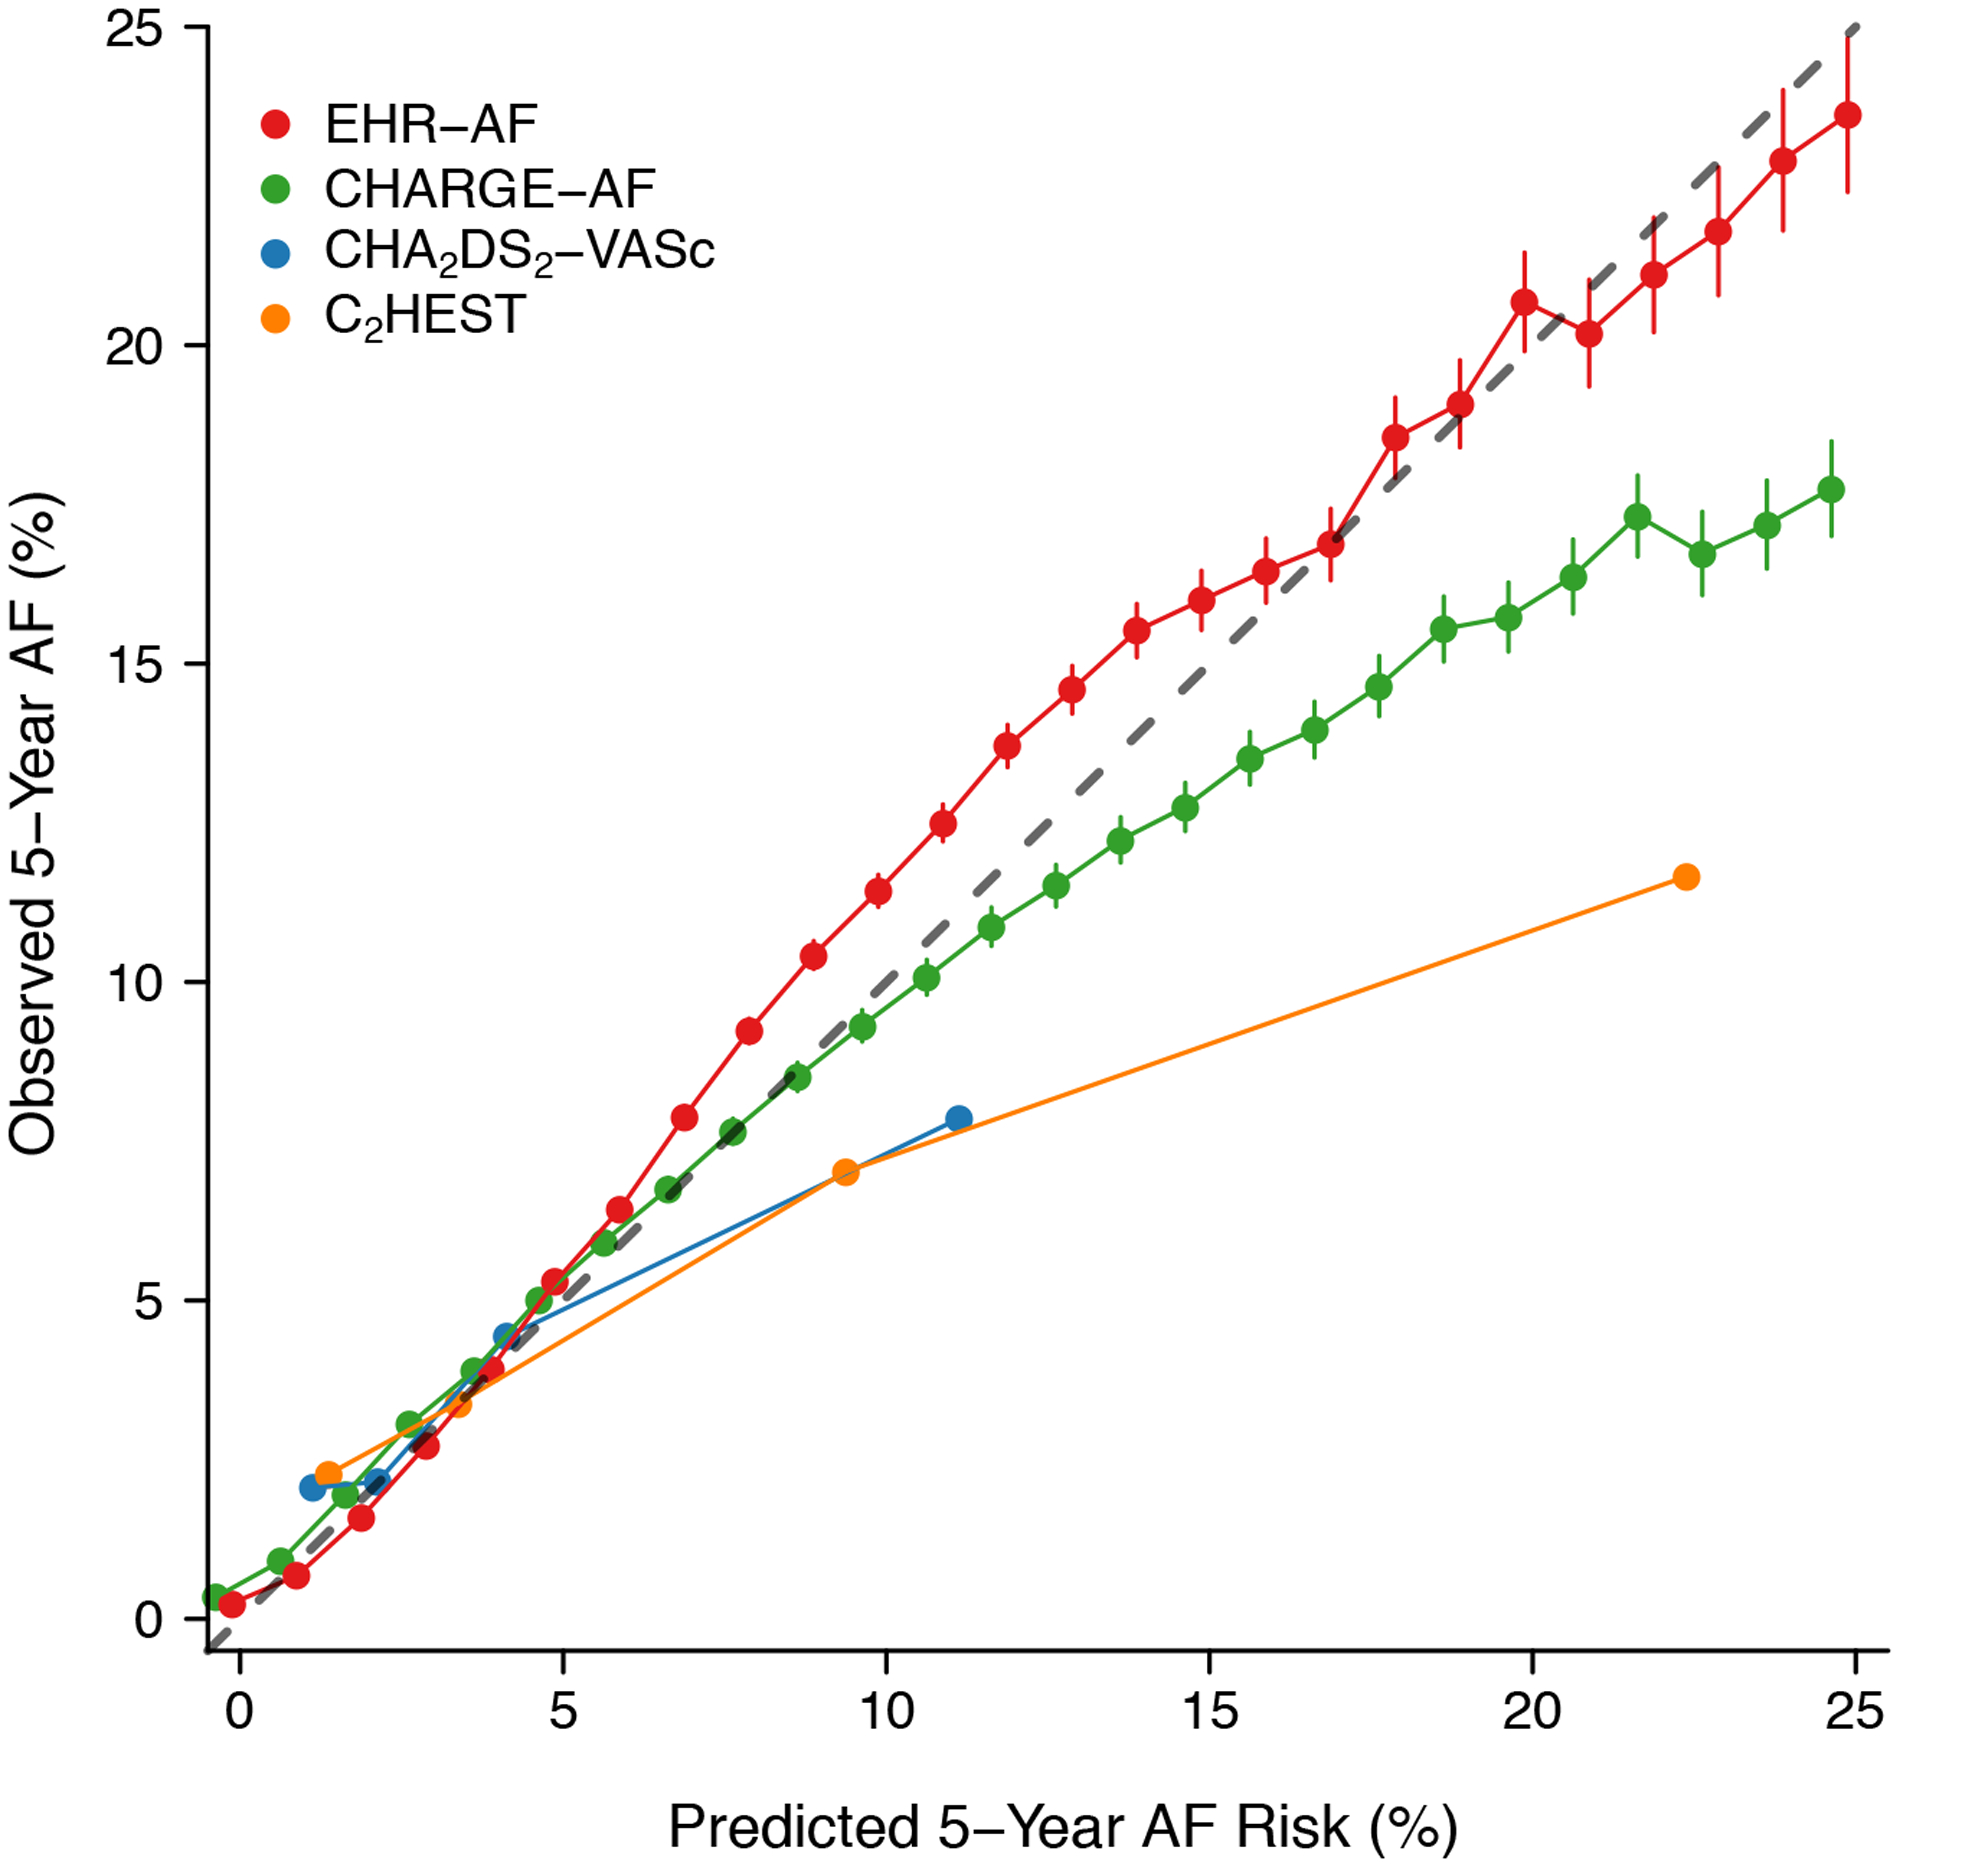
Figure 1.

Predicted versus observed AF rates by score. Depicted is the observed 5-year AF rate (y-axis) versus increasing predicted 5-year AF risk (x-axis) determined using each of four AF risk schemes: EHR-AF, CHARGE-AF, C2HEST, and CHA2DS2-VASc. Each point represents estimated AF risk rounded to the nearest whole number. The gray line demonstrates perfect correspondence between predicted and observed risk. Points above the gray bar represent underestimation of true AF risk, while points below the gray bar represent overestimation of true AF risk. Fewer points are present for CHA2DS2-VASc and C2HEST given the discrete nature of these scores.
