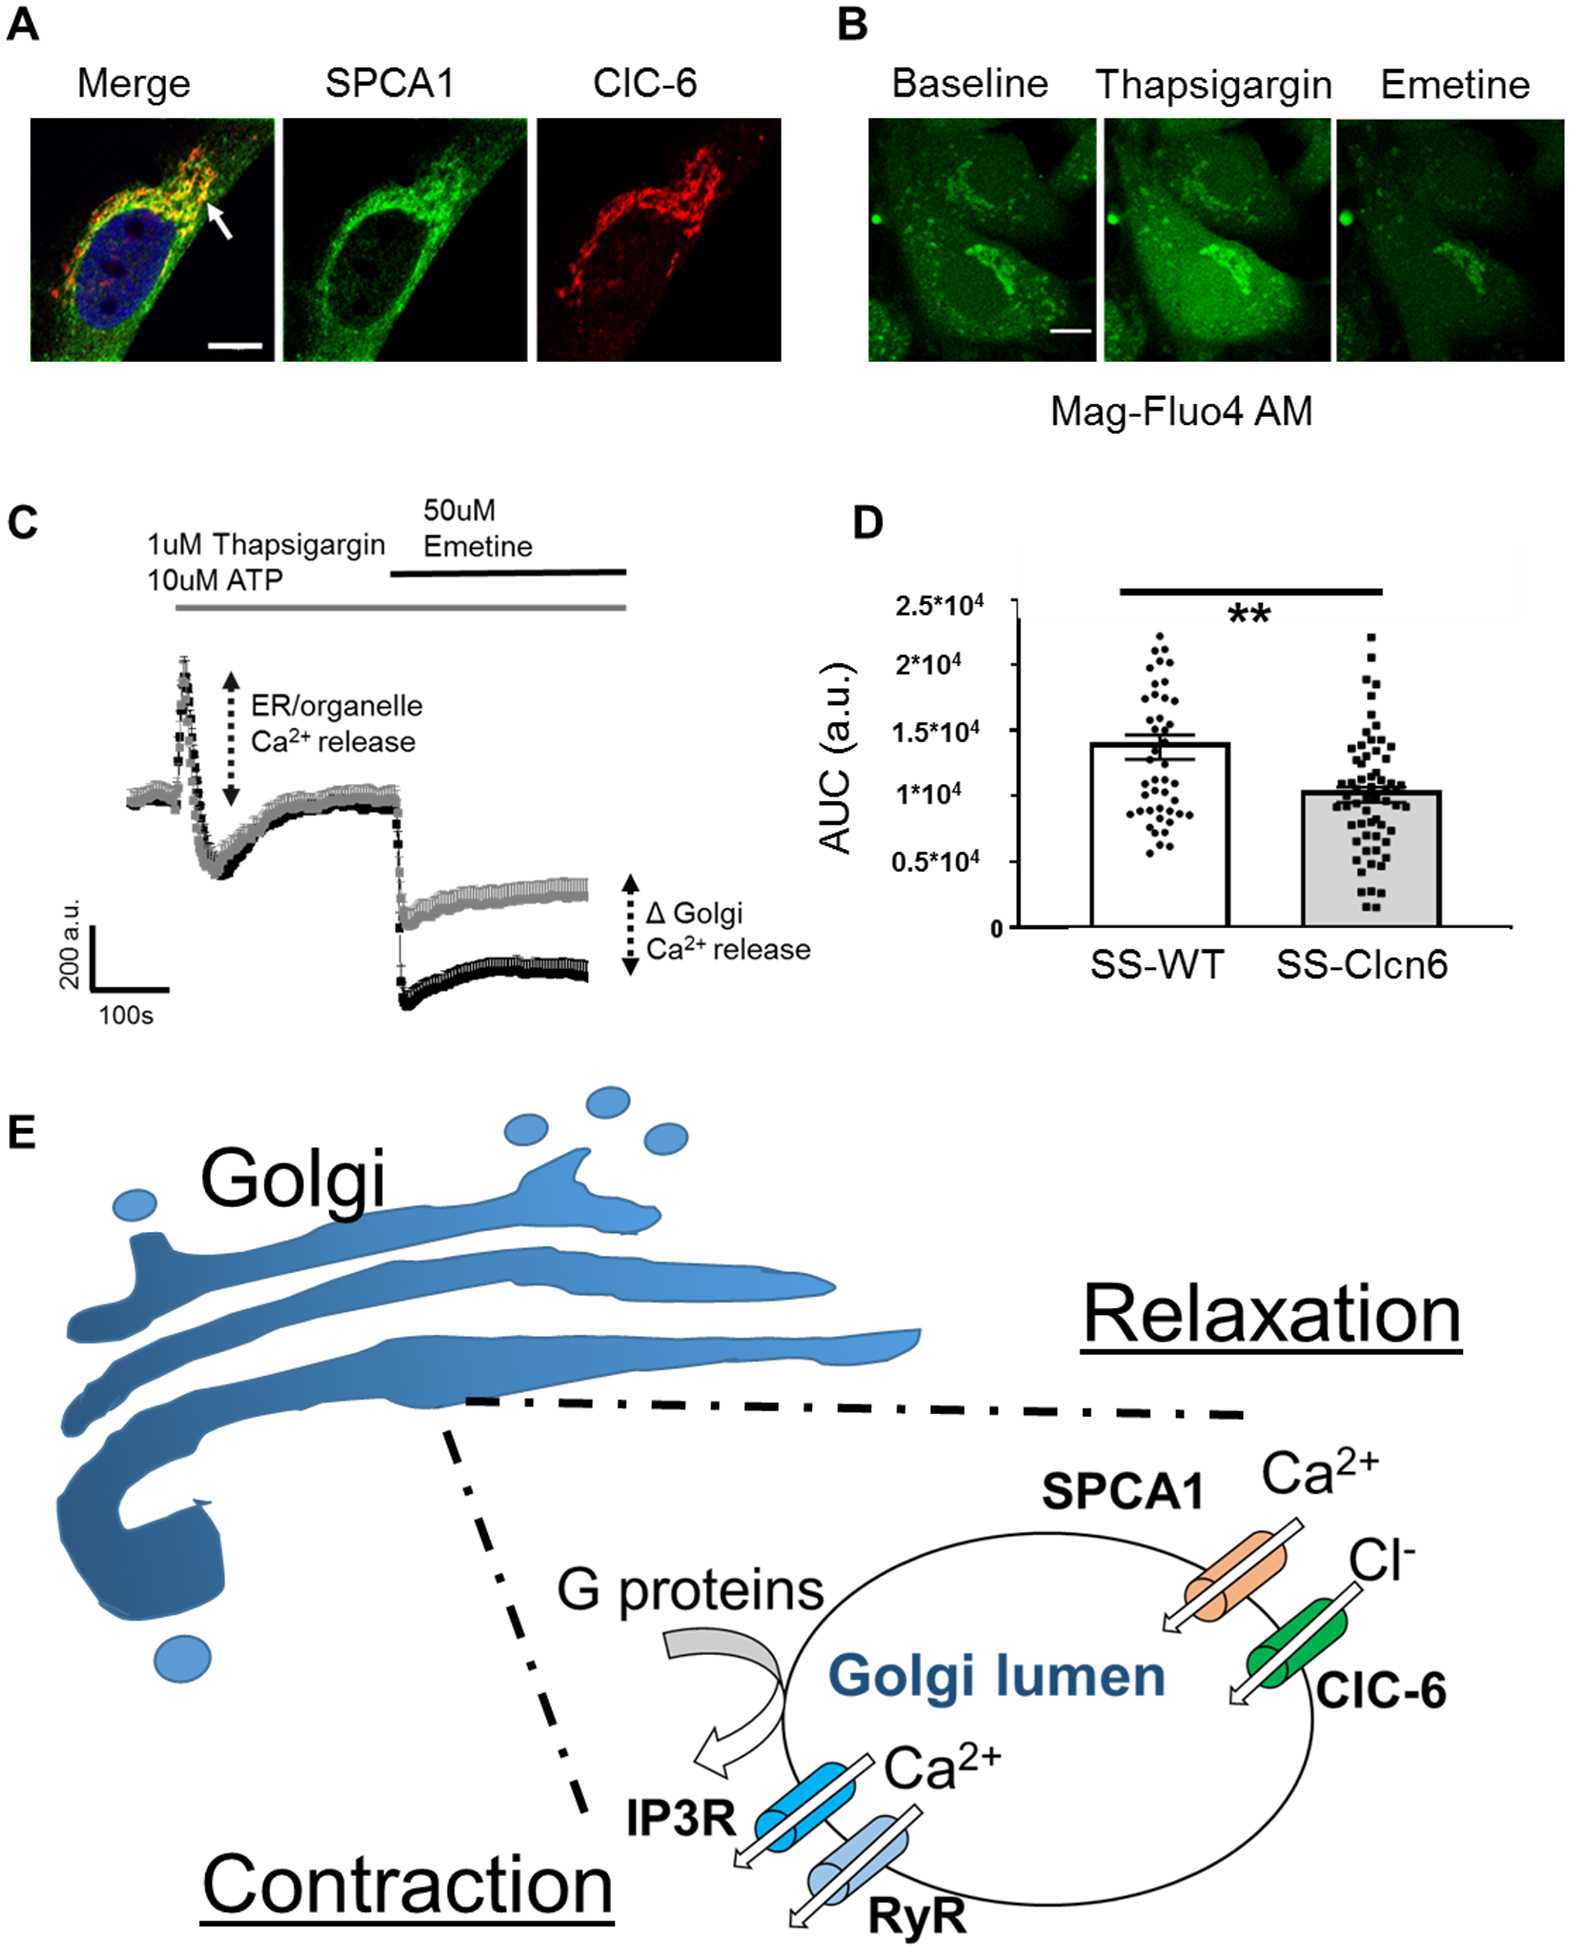
Figure 6. Golgi Ca2+ stores are reduced in SS-Clcn6 vSMCs.

(A) Immunofluorescence labeling of SPCA1 (green) and ClC-6 (red) in a vSMC. Note the distinct area of co-localization (arrow). Scale bar is 10 μm. (B) Representative images of vSMCs loaded with Mag-Fluo4 at baseline (left), immediately after TG + ATP application (middle), and after Emetine application (right). Scale bar is 10 μm. First cells were stimulated with 1 μM Thapsigargin (TG) +10 μM ATP to release ER Ca2+, then stimulated with 50 μM Emetine to release Golgi Ca2+ stores. (C) Changes in Ca2+ over time were determined by ROIs drawn over the Golgi region. Average curve values ± SEM of SS-WT (black) or SS-Clcn6 (grey) vSMC Golgi Ca2+. There is no significant difference between the cells following 1 μM TG + 10 μM ATP; however, the [Ca2+]golgi release (as determined by the area under the curve (AUC) resulting from 50 μM Emetine) was significantly reduced in the SS-Clcn6 VSMCs. (D) Summary graph of AUC measurements from all experiments (N=4 experiments, n≥46 cells, **p<0.01). (E) Proposed molecular mechanism for ClC-6 in Golgi calcium handling. In response to a contractile stimulus such as phenylephrine, G-protein coupled signaling cascades result in release of lumenal [Ca2+]Golgi stores through IP3Rs and RyRs, which contribute to the [Ca2+]i pool. Upon relaxation, the secretory pathway calcium ATPase (SPCA1) removes cytosolic calcium back into the Golgi lumen, and this positive charge influx is balanced by concurrent chloride entry via ClC-6.
