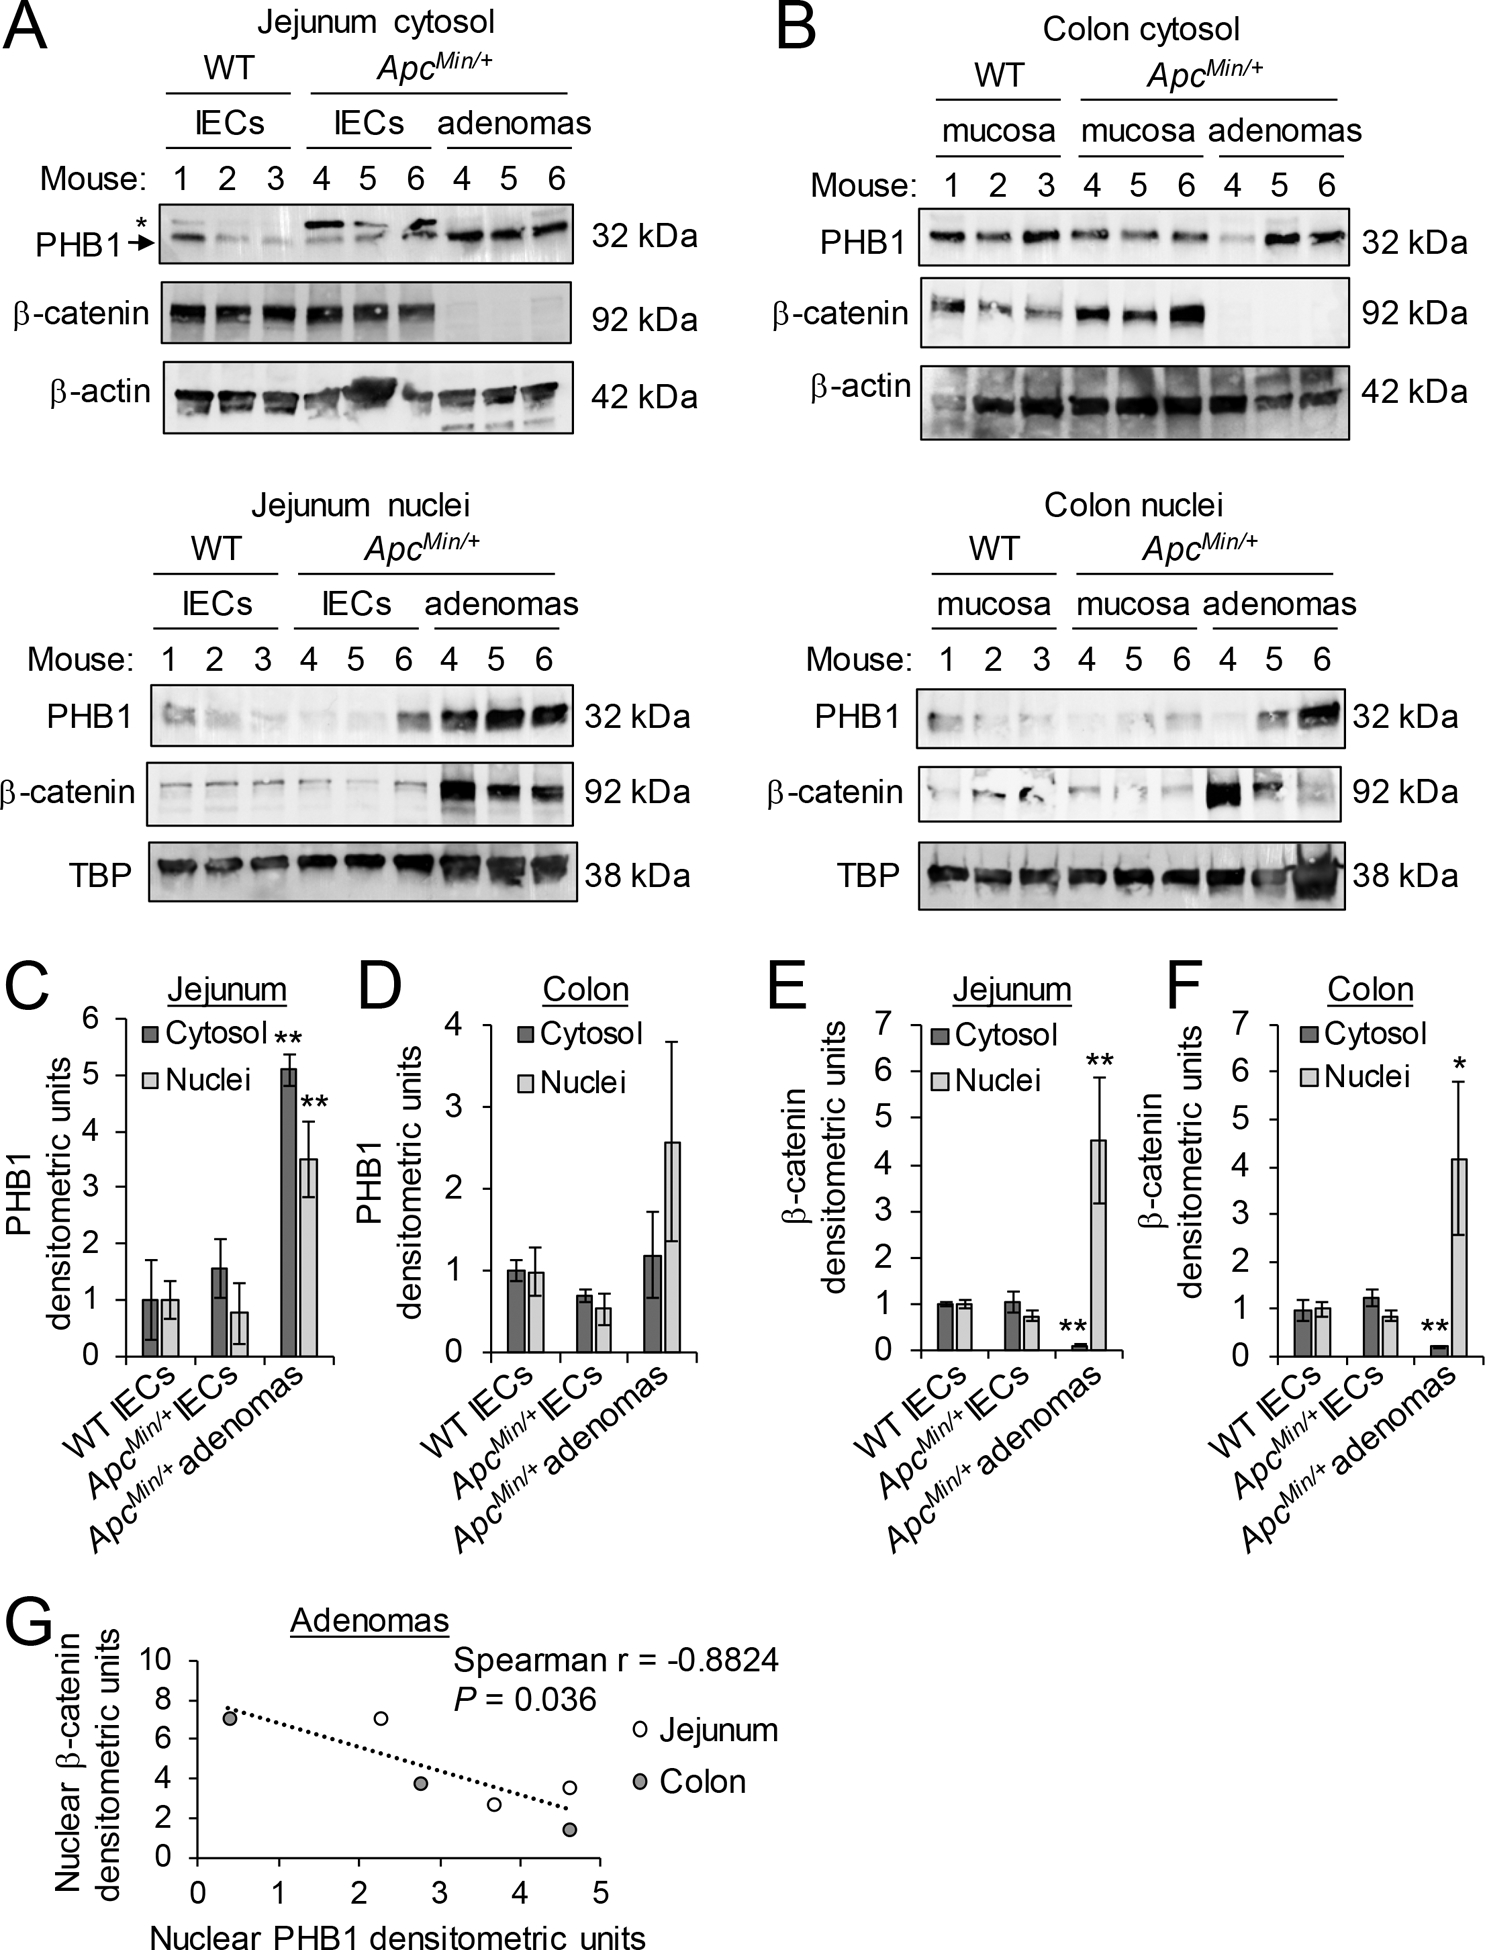
Figure 1. PHB1 expression inversely correlates with β-catenin expression in adenomas.

Western blots of nuclear and cytosolic protein fractions of isolated IECs from jejunum (A) or mucosa of colon (B) of wild-type (WT) and ApcMin/+ mice or isolated adenomas from ApcMin/+ mice. *denotes non-specific band in (A), likely family member PHB2. Mean ± SEM of PHB1 western blot densitometry in jejunum (C) or colon (D). Mean ± SEM of β-catenin western blot densitometry in jejunum (E) or colon (F). (G) Spearman rank correlation of western densitometry in nuclear fraction of adenomas. n = 3 mice per group. *P < 0.05, **P < 0.01 vs. WT IECs by one-way ANOVA followed by Bonferroni’s test.
