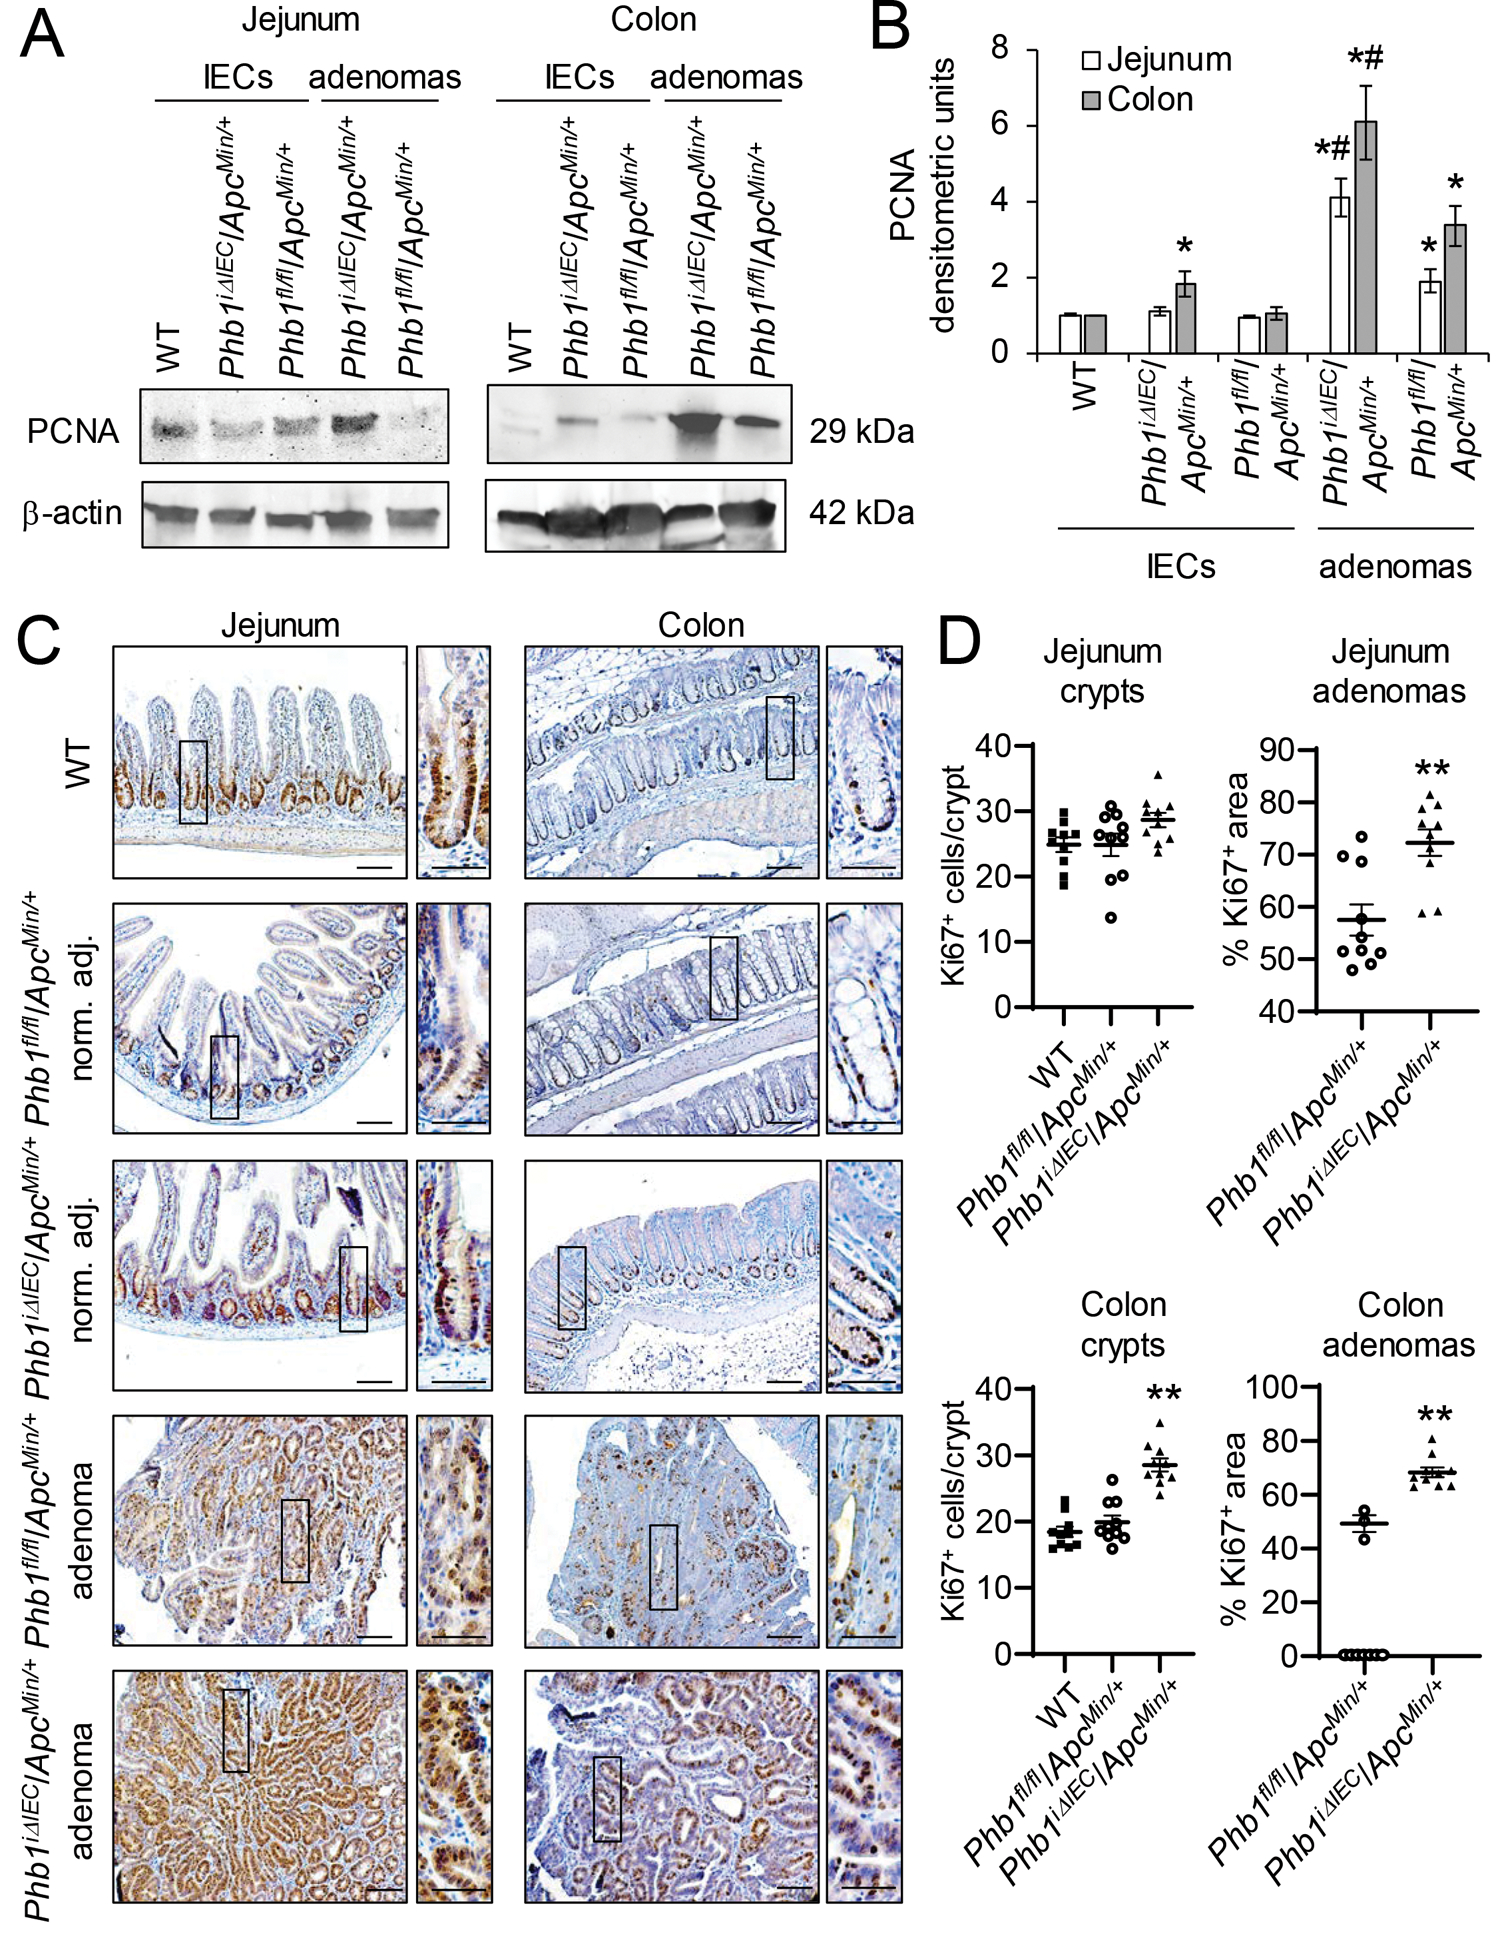
Figure 3. PhbiΔIEC/ApcMin/+ mice exhibit increased proliferation in adenomas and colonic IECs.

(A) Representative western blots of PCNA (marker of proliferation) in isolated IECs or adenomas from Phbfl/fl/ApcMin/+ or PhbiΔIEC/ApcMin/+ mice compared to IECs from wild-type (WT) mice. (B) Mean ± SEM of PCNA normalized to β-actin densitometric units. n = 3 (WT) or 6 mice (all other groups). *P < 0.05 vs Phbfl/fl/ApcMin/+ IECs, #P < 0.05 vs Phbfl/fl/ApcMin/+ adenomas by one-way ANOVA followed by Bonferroni’s test. (C) Ki67 immunohistochemistry staining in adenomas or normal adjacent tissue. Scale bars: 100 μm; boxed pullouts: 50 μm. (D) Ki67+ cells/crypt and percentage of the area of Ki67 immunostaining in adenomas per mouse ± SEM. Mice without adenomas present in colon sections are plotted as 0 on the X-axis. n =10 mice per group. **P < 0.01 vs Phbfl/fl/ApcMin/+ by unpaired, two-tailed Student’s t test.
