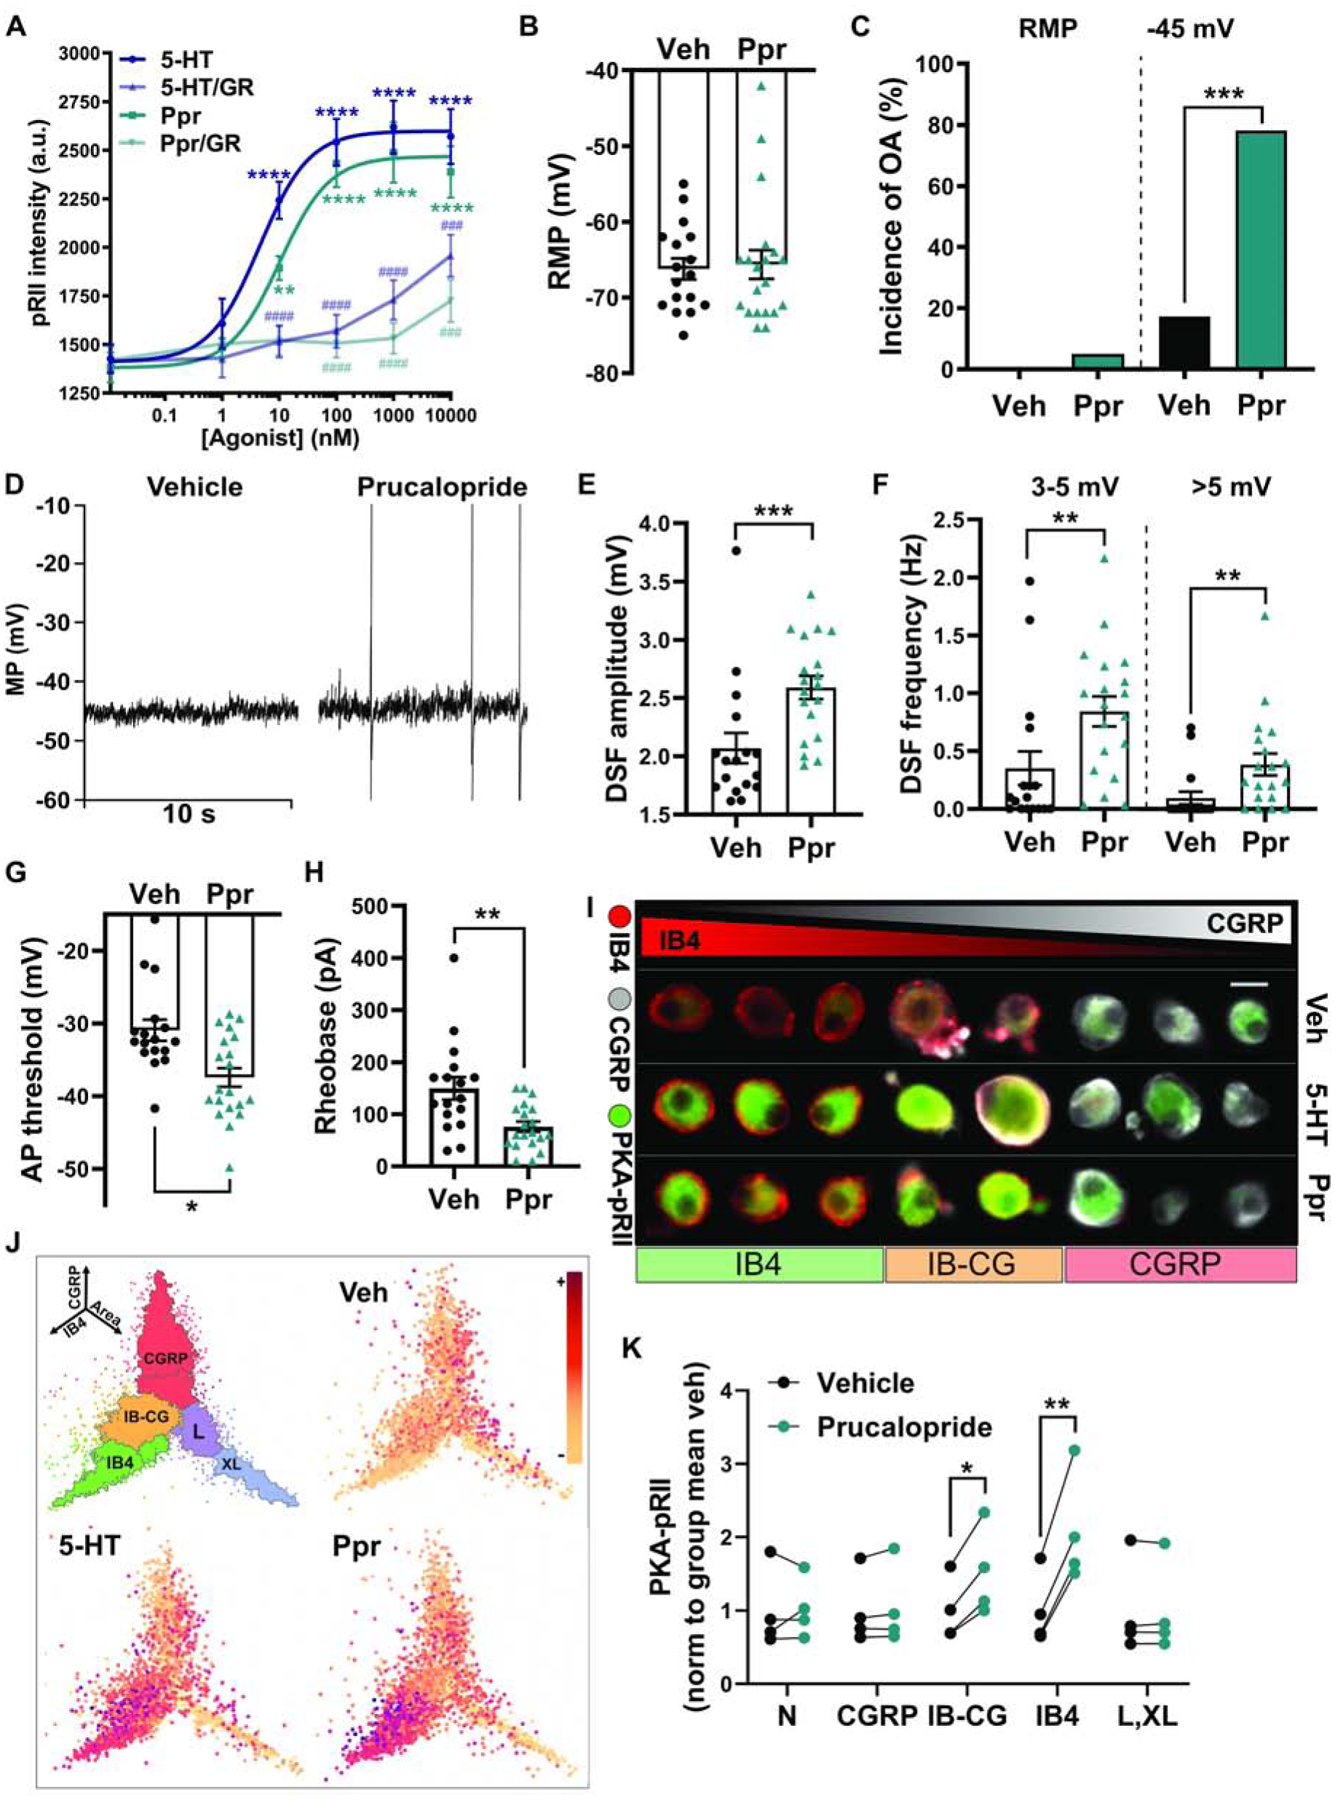
Figure 3. Selective 5-HT4 receptor activation induces hyperexcitability in probable nociceptors.

(A) Dose-dependent PKA activation by 5-HT and the 5-HT4 agonist prucalopride (Ppr), and inhibition of this effect by the 5-HT4 receptor antagonist GR113808 (GR). Vehicle (DMSO) or 1 μM GR113808 was co-applied with 5-HT or prucalopride for 5 min. Each data point represents the mean ± SEM of 3 separate experiments. Asterisks indicate significant difference of the agonist dose compared with no agonist. Hash marks indicate significant difference in the presence of antagonist compared with no antagonist. ** Dunnett’s adjusted p value < 0.01, ### Tukey’s adjusted p value < 0.001, ****/#### Dunnett’s/Tukey’s adjusted p value < 0.0001. (B) Lack of effect of prucalopride on RMP measured during electrophysiological recordings from cells continuously exposed to 300 nM prucalopride before and during recording. Mean ± SEM. (C) Effect of prucalopride on the incidence of OA determined from ≥60-s recordings at RMP then 30-s recordings at ~−45 mV. *** p < 0.001. (D) Representative traces of neurons treated with vehicle (DMSO) or prucalopride and depolarized to −45 mV. (E, F) Effects of prucalopride on the mean DSF amplitude and the frequency of medium- (3–5 mV) and large-amplitude (> 5 mV) DSFs during 30-s depolarization to −45 mV. Mean ± SEM. ** p < 0.01 *** p < 0.001. (G) Effect of prucalopride on the AP voltage threshold. Mean ± SEM. * p < 0.05. (H) Effect of prucalopride on the rheobase. Mean ± SEM. ** p < 0.01. (I) Examples of cell staining for PKA-pRII. Scale bar = 25 μm. (J) PKA-RII phosphorylation in controls, 300 nM 5-HT and 300 nM prucalopride, shown as coordinates of soma area (X-axis), CGRP staining intensity (Y-axis), and IB4 staining intensity (Z-axis). n > 15,000 neurons. (K) Prucalopride responses measured by PKA-pRII levels in specific neuronal subpopulations: N (negative for IB4 and CGRP and small somata), CGRP, IB-CG (weak staining for both IB4 and CGRP), L,XL (large and extra-large somata), and IB4. Each point represents the mean from one experiment normalized to the subpopulation baseline from the same experiment (n = 4 rats). * p < 0.05 ** p < 0.01.
