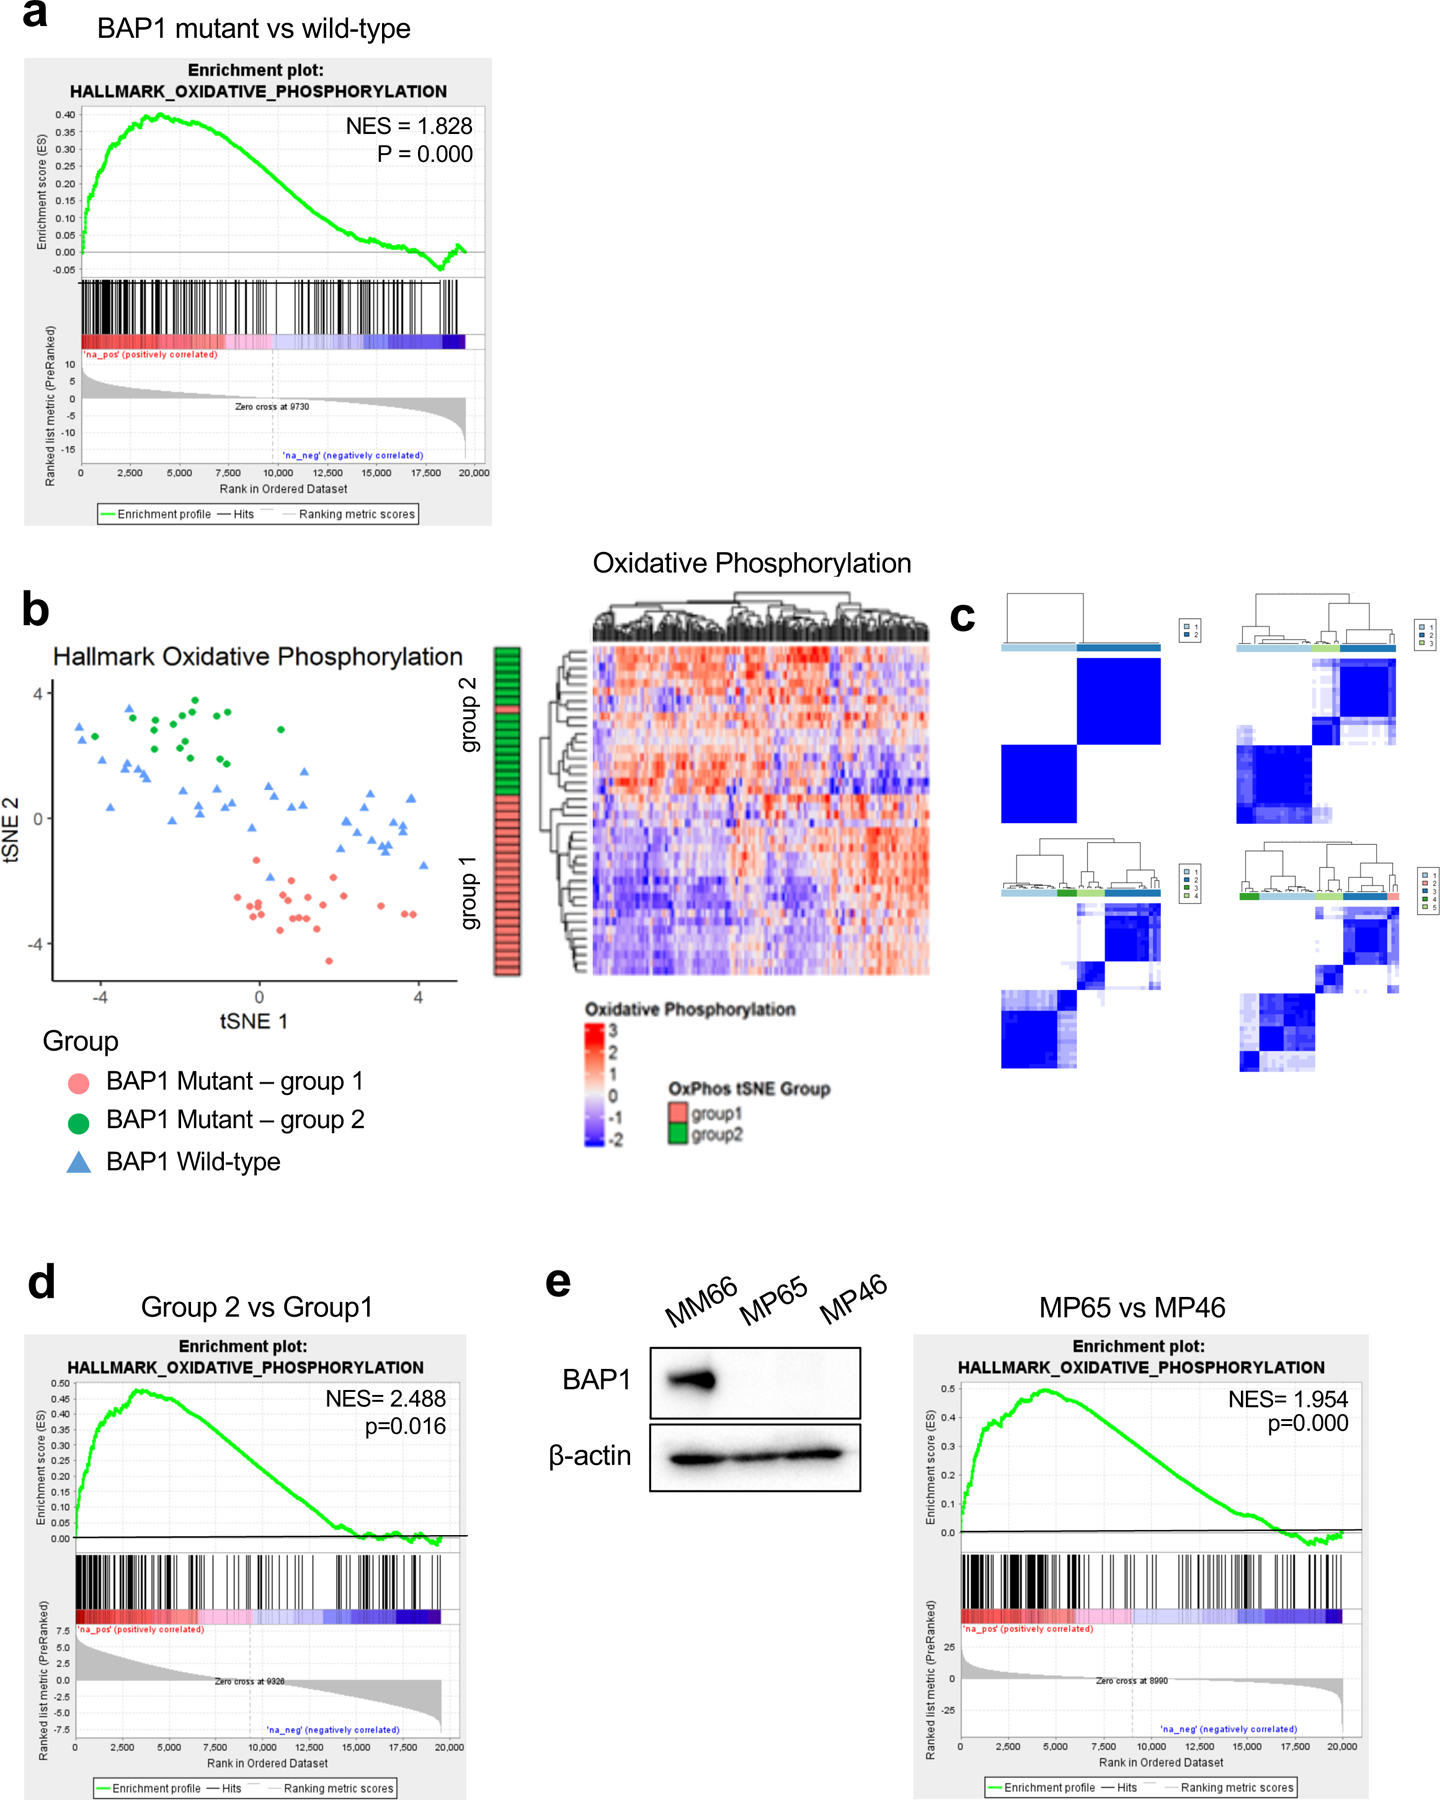
Fig 1. BAP1 mutant UM samples are divided into two distinct metabolic subpopulations based on OXPHOS gene set.

UVM RNA-seq V2 gene expression data from TCGA were retrieved from the latest Broad GDAC Firehose data run (stddata_2016_01_28). Based on BAP1 mutation and copy loss, samples were stratified into BAP1 mutant and wild-type groups. Differential expression analysis was performed between BAP1 mutant (n=40) and wild-type (n=40) and used for performing GSEA. a. GSEA enrichment plots of the OXPHOS hallmark gene set for comparison in BAP1 mutant vs wild-type group. b. tSNE plot of BAP1 mutant samples grouped into two subgroups (group 1 and group 2) and BAP1 wild-type samples based on OXPHOS genes. Heatmaps of OXPHOS gene expression from the RNA-seq data for BAP1 mutant samples with group indexing based on tSNE clustering Fig. 1b. c. Sample-group similarity matrices from consensus cluster plus k-means clustering analysis of BAP1 mutant UM samples, with the number of groups ranging from 2 to 5. d. GSEA enrichment plot of the top-ranked OXPHOS hallmark gene set for comparison in group 2 vs group 1. e. Protein expression of BAP1 in BAP1 wild-type (MM66) and two BAP1 mutant (MP65 and MP46) UM cell lines was analyzed by western blot. GSEA enrichment plot of the top-ranked OXPHOS hallmark gene set for comparison in MP65 vs MP46 cells.
