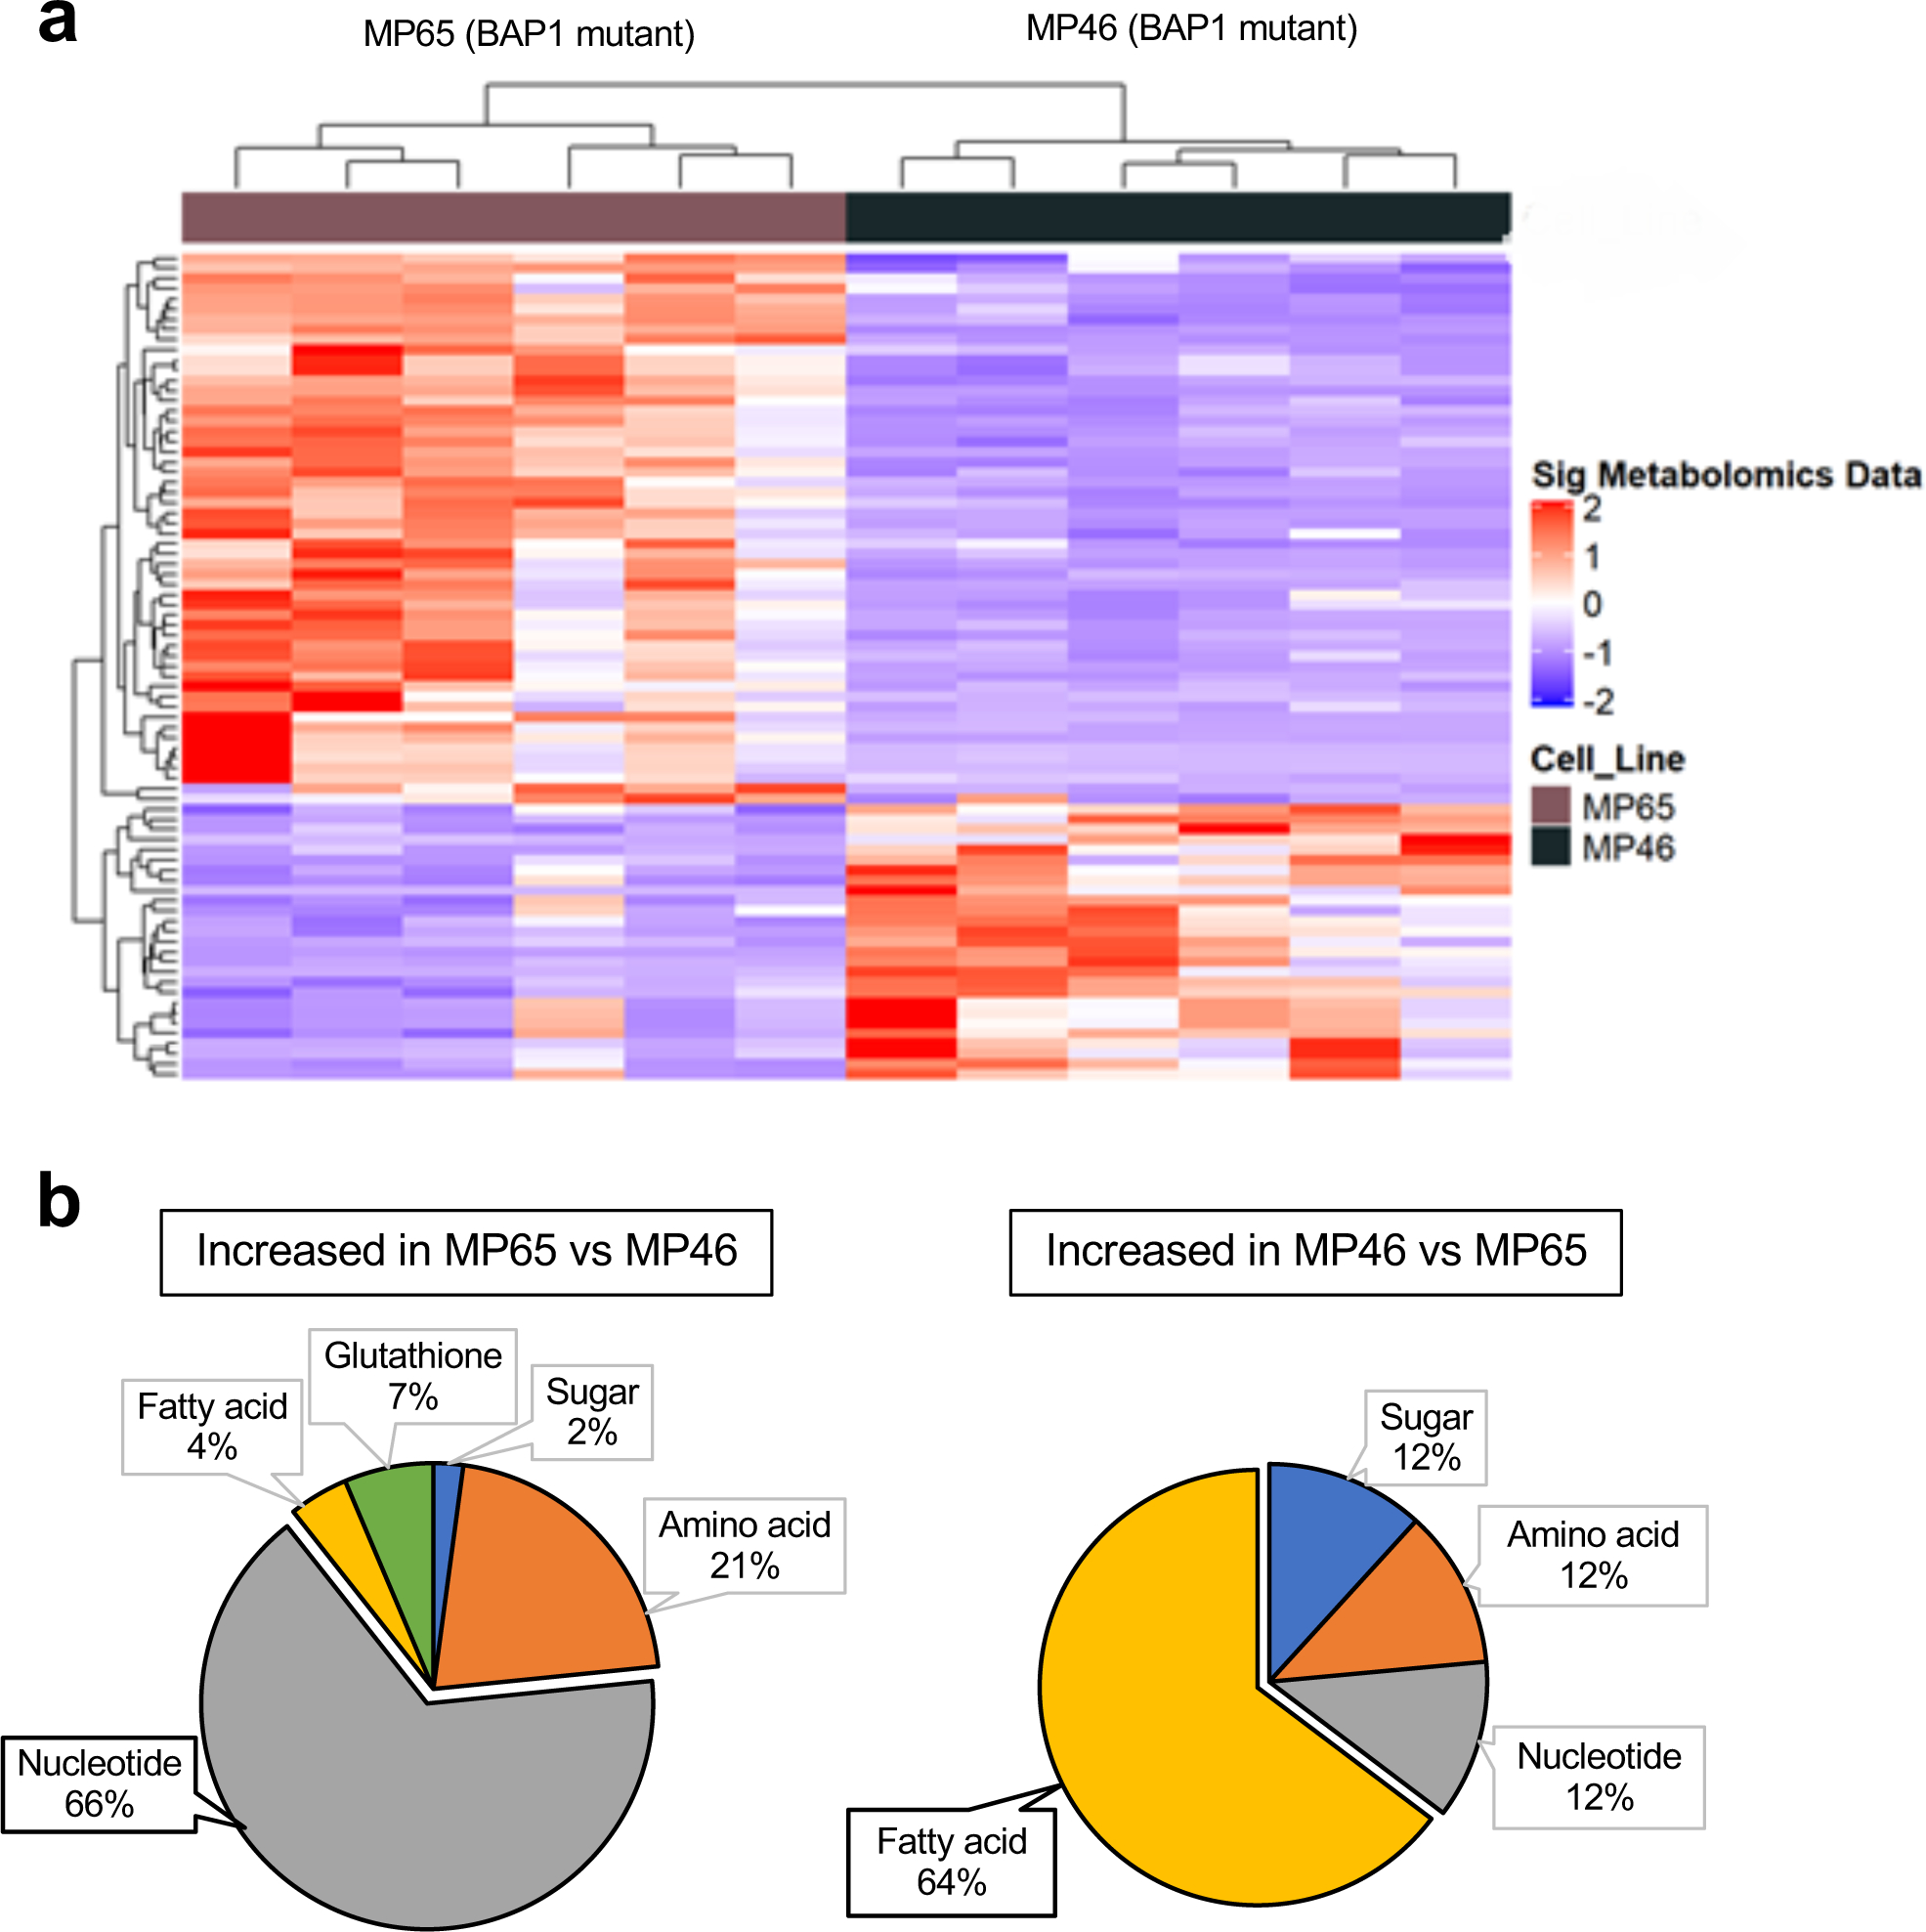
Fig 2. BAP1 status alters the metabolic pathways in UM cells.

a. Heatmap showing z-scores for significantly different levels of metabolites (FC >2, adj. p-val. < 0.05) between two BAP1 mutant cell lines, MP65 and MP46. Unsupervised hierarchical clustering of samples and metabolites is shown. b. Percentage distributions of upregulated metabolites in MP65 or MP46 cells. Metabolites were categorized with specific metabolic pathways (FC >2, adj. p-val. < 0.05). Metabolite data were analyzed from whole cell extractions (n=6).
