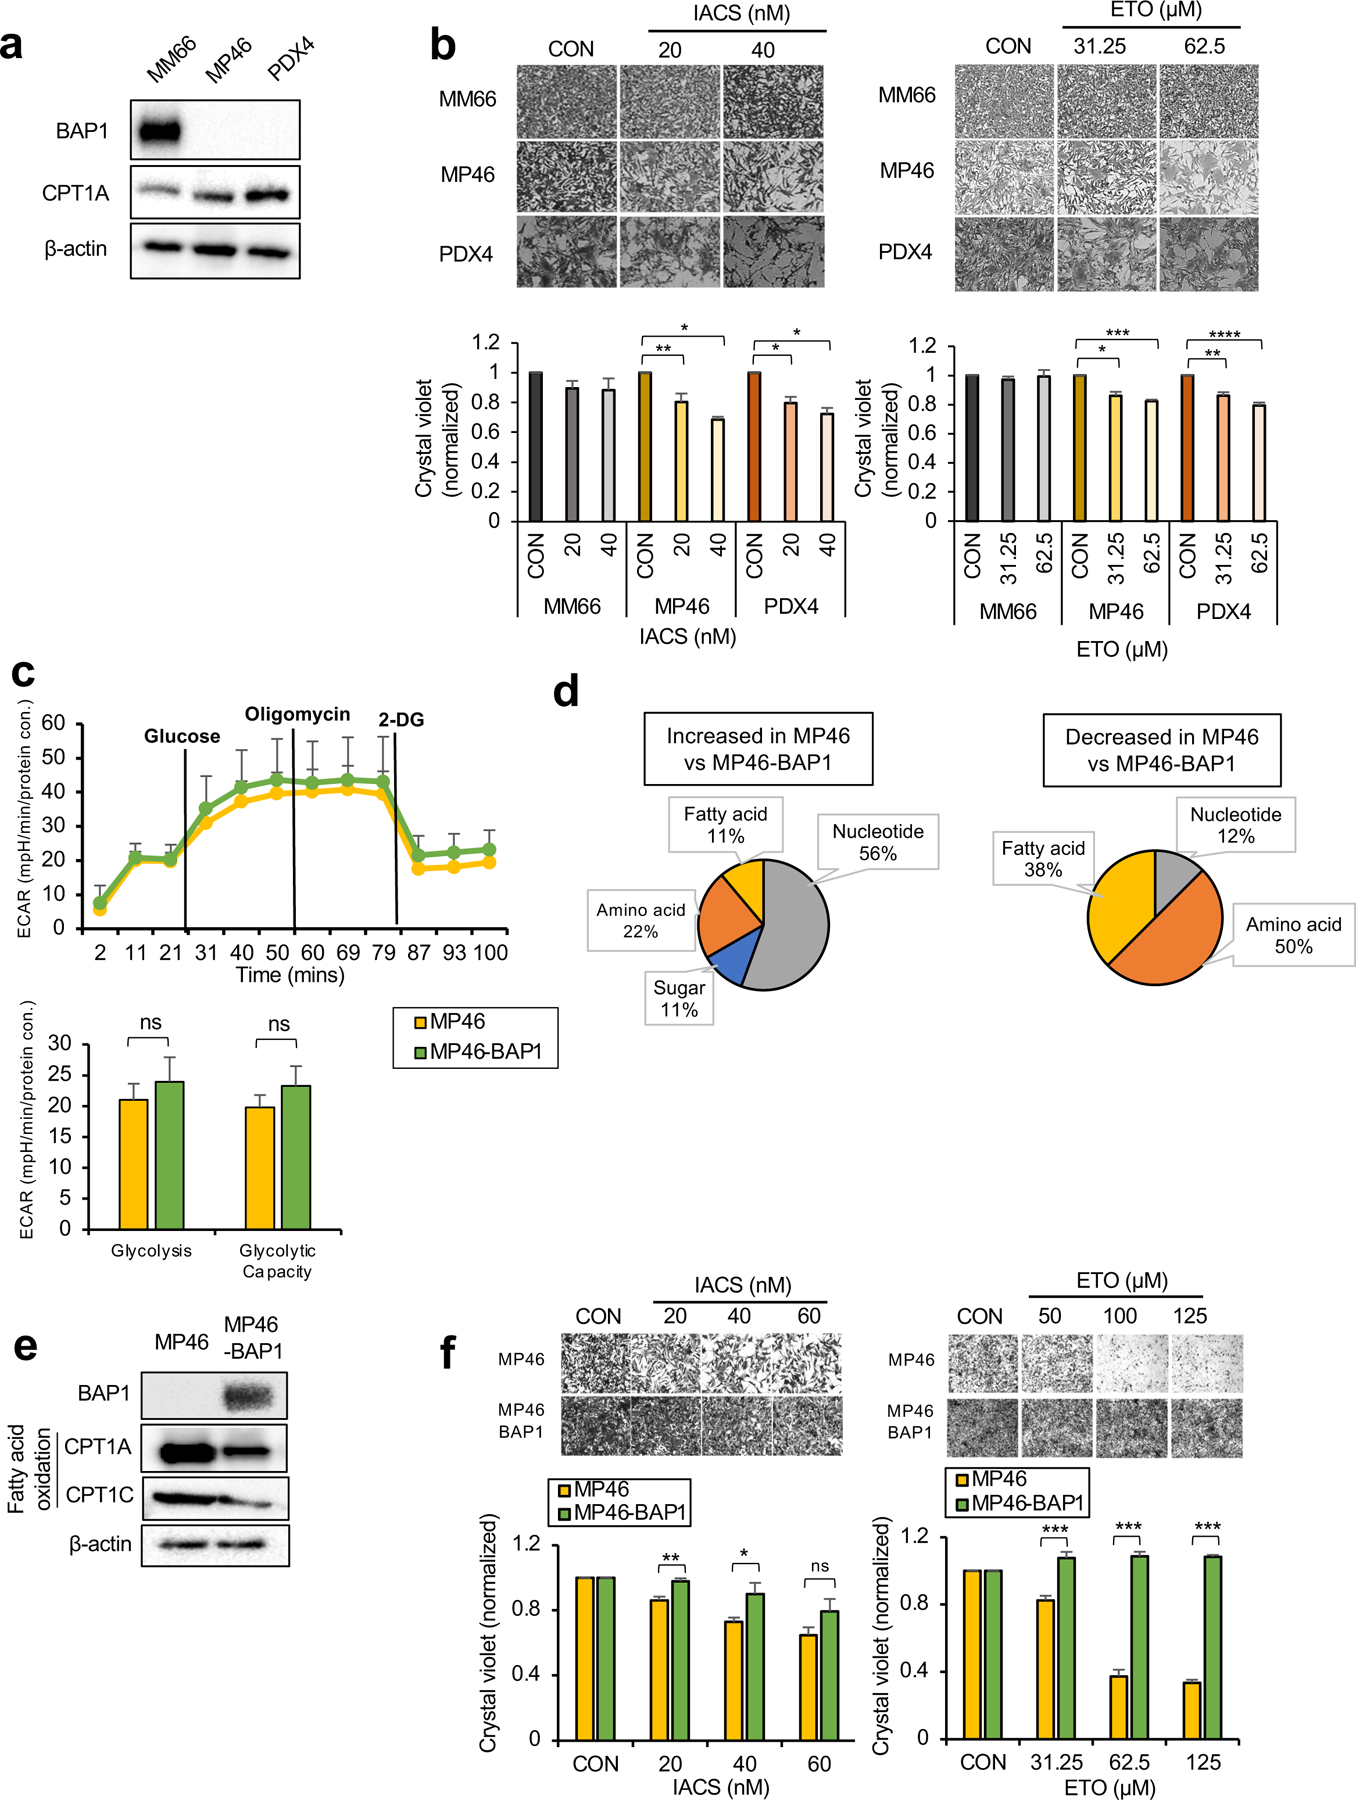
Fig 4. OXPHOSlow BAP1 mutant phenotype is associated with an elevated FA oxidation pathway.

a. Protein expression of BAP1 and metabolic enzymes involved in FAO in MM66, MP46 and PDX4 cells. b. MM66, MP46 and PDX4 cells were treated with IACS (20 or 40 nM) or etomoxir (ETO, 31.25 or 62.5 μM) for 3 days. Cell viability changes were determined by crystal violet staining. Quantification of cell growth with IACS or ETO treatments in cells presented as fold change in crystal violet staining. Representative crystal violet images of cell growth are shown. Scale bar represents 100 μm. c. Effects of BAP1 re-expression on the glycolytic capacity of MP46 cells was measured by ECAR using the Seahorse XF24 Analyzer. Seahorse data were normalized to protein concentration and generated by Agilent Seahorse XF report generators. Data are shown as mean ± SEM (n=12). d. Metabolite percentage distribution within specific metabolic pathways that are upregulated or down-regulated in MP46 compared to MP46-BAP1 cells (FC >2, adj. p-val. < 0.05). e. Protein expression of metabolic enzymes involved in FA synthesis and oxidation in MP46 and MP46-BAP1 cells. f. MP46 and MP46-BAP1 cells were treated with IACS (20, 40 or 60 nM) or etomoxir (ETO, 31.25, 62.5 or 125 μM) for 5 days. Cell viability changes were determined by crystal violet staining. Quantification of cell growth with IACS and ETO treatments in cells presented as fold change in crystal violet staining. Data are shown as mean ± SEM from biological replicate experiments (n=4). *p<0.05, **p<0.01, ***p<0.001 and not significant (ns) unpaired t-test. ECAR; extracellular acidification rate, CPT1; carnitine palmitoyltransferase1, 2DG; 2-deoxyglucose and PHX; perhexiline.
