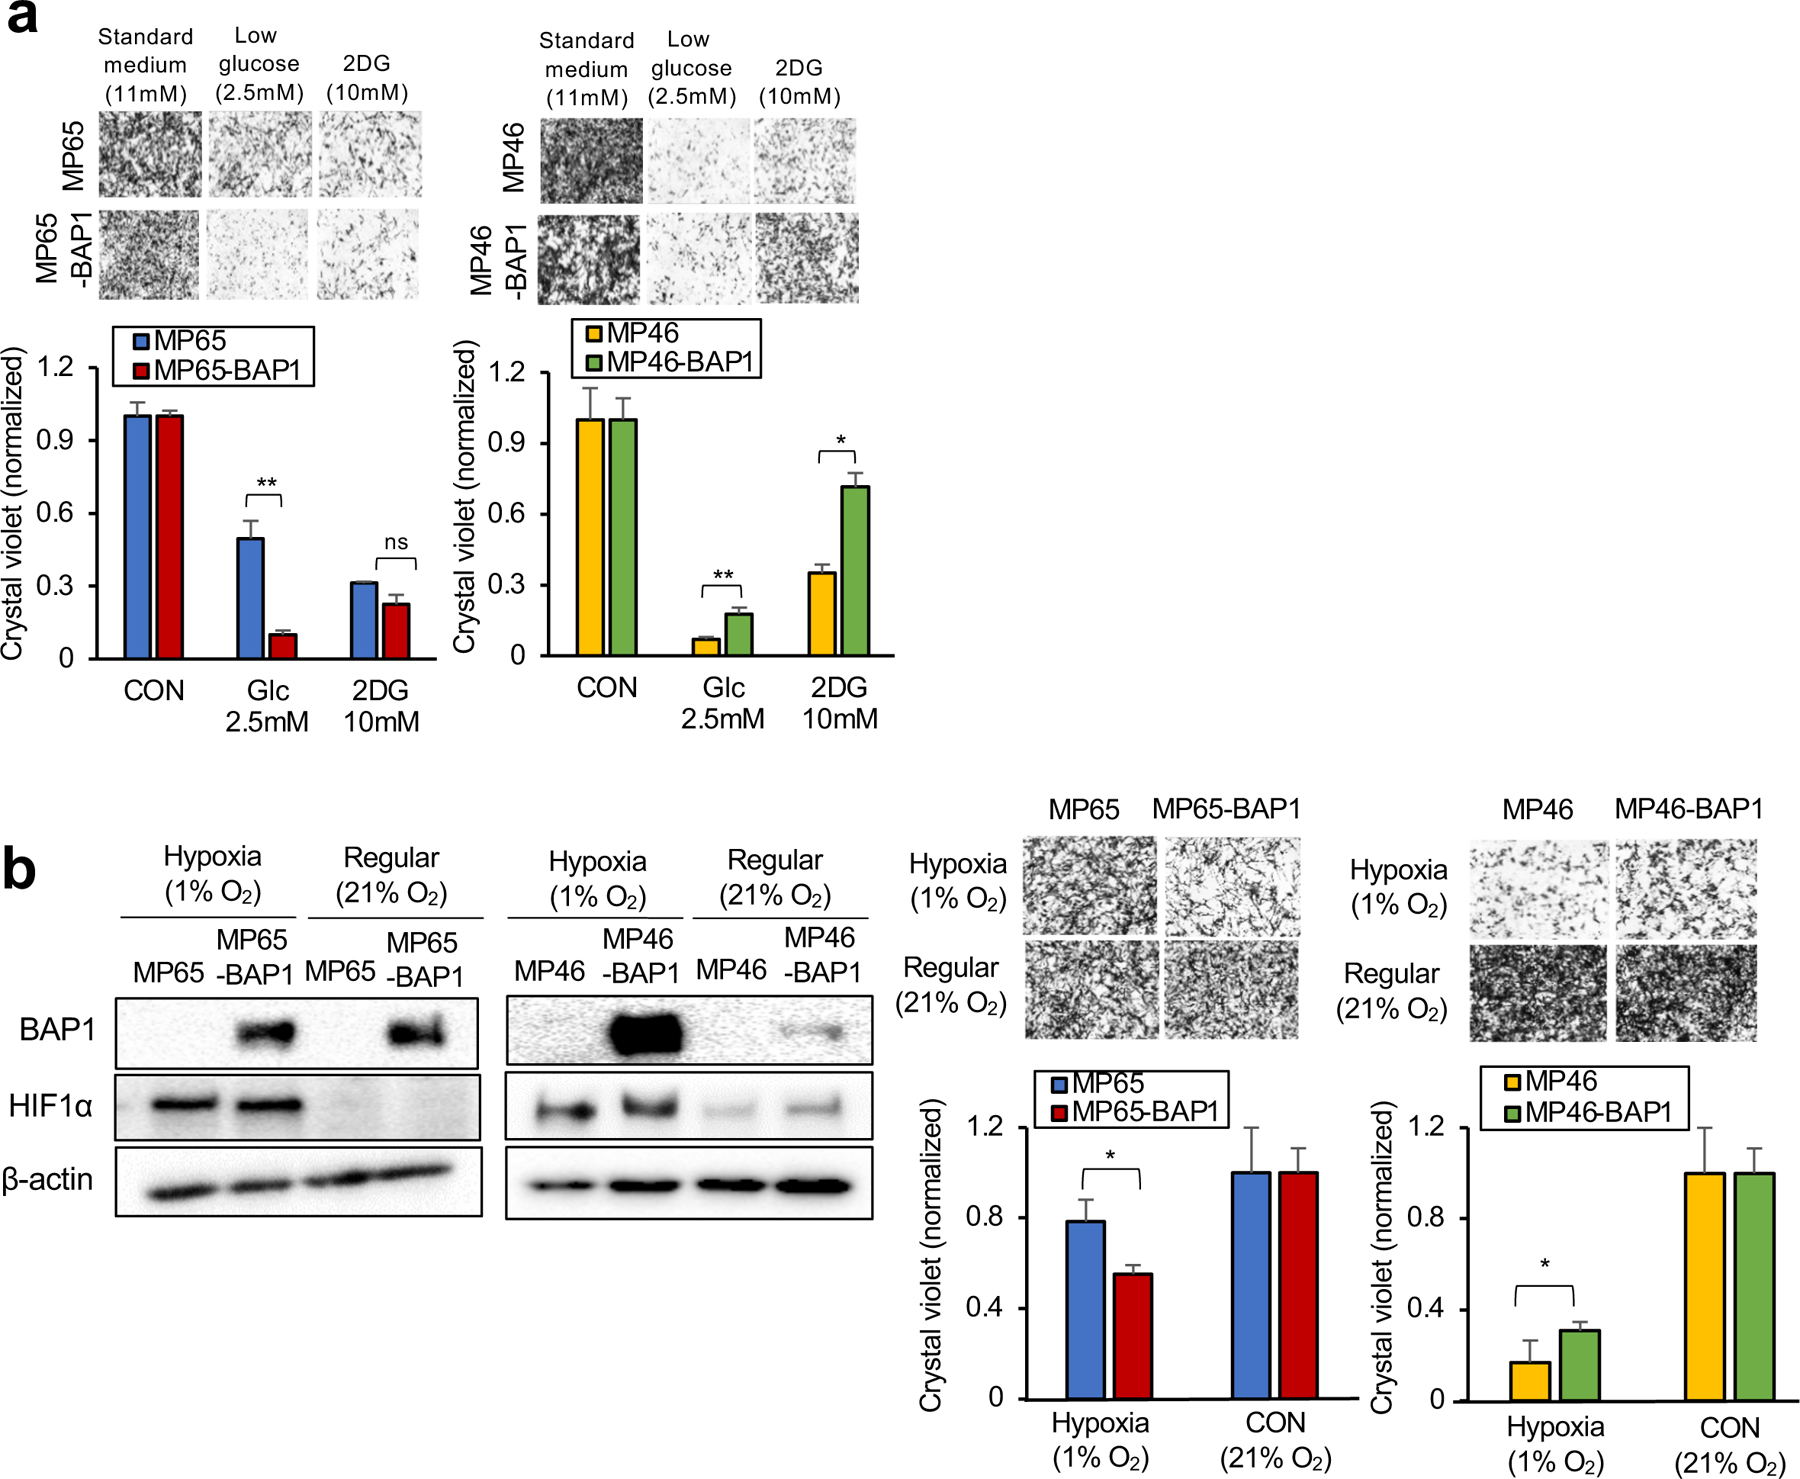
Fig 5. The two metabolic phenotypes respond differently to metabolic stress.

MP65, MP65-BAP1, MP46 and MP46-BAP1 cells were exposed to metabolic stress; glucose deprivation for 3 days or hypoxic conditions for 5 days. a. Cells were cultured in regular growth medium (11 mM glucose), medium with low glucose (2.5 mM) or medium containing 2-DG (10 mM) for 3 days. b. For 5 days, the cells were under either hypoxic (1% O2) or normoxic (21% O2) conditions. As a marker of hypoxia, expression of HIF1α was probed on day 3 by western blotting. Cell viability changes were measured by crystal violet staining. Representative crystal violet images of cell growth are shown. Scale bar: 100 μm. Data are shown as mean ± SEM from biological replicate experiments (n=4). The unpaired t-test was used for statistical significance. *p<0.0, **p<0.01 and not significant (ns).
