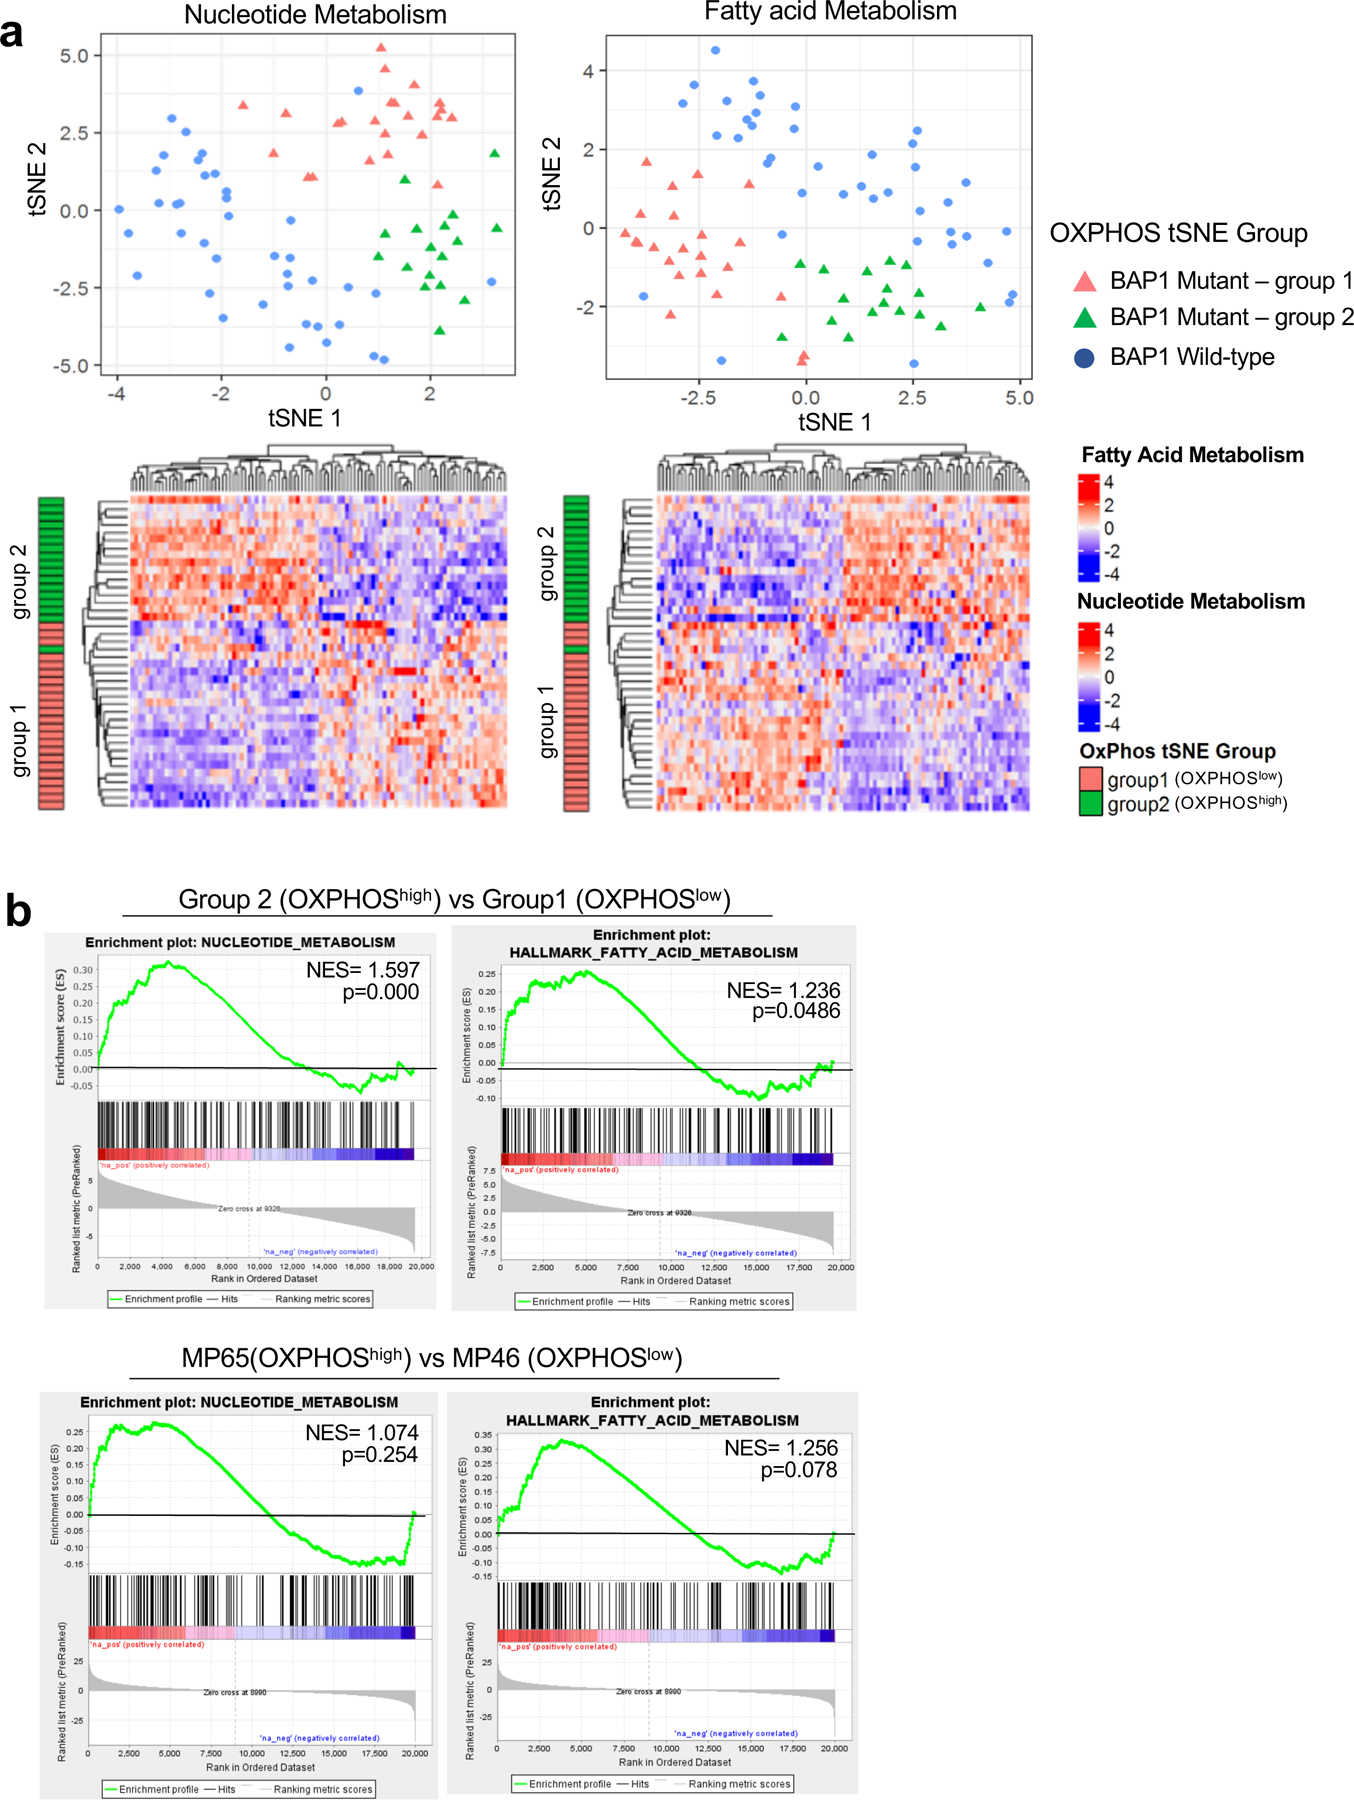
Fig 6. Nucleotide and FA metabolism gene expression separate BAP1 mutant samples into two distinct subgroups.

UM RNA-seq V2 gene expression data from the TCGA were retrieved from the latest Broad GDAC Firehose data run (stddata__2016_01_28). The samples were stratified into BAP1 mutant and wild-type groups based on BAP1 mutation and copy loss. Differential expression analysis was performed between BAP1 mutant (n=40) and wild-type (n=40). a. tSNE plot presenting BAP1 mutant samples with two subgroups (group 1 and group 2) and BAP1 wild-type samples based on nucleotide metabolism (left) and FA metabolism (right) genes. Below, heatmaps showing unsupervised hierarchical clustering of z-scores for each gene set in BAP1 mutant samples with group indexing based on OXPHOS clustering analysis in Fig. 1. b. GSEA plots of the nucleotide and FA metabolism gene set for comparison of group 2 vs group 1 in BAP1 mutant UM data from TCGA, and two BAP1 mutant cells, MP65 vs MP46.
