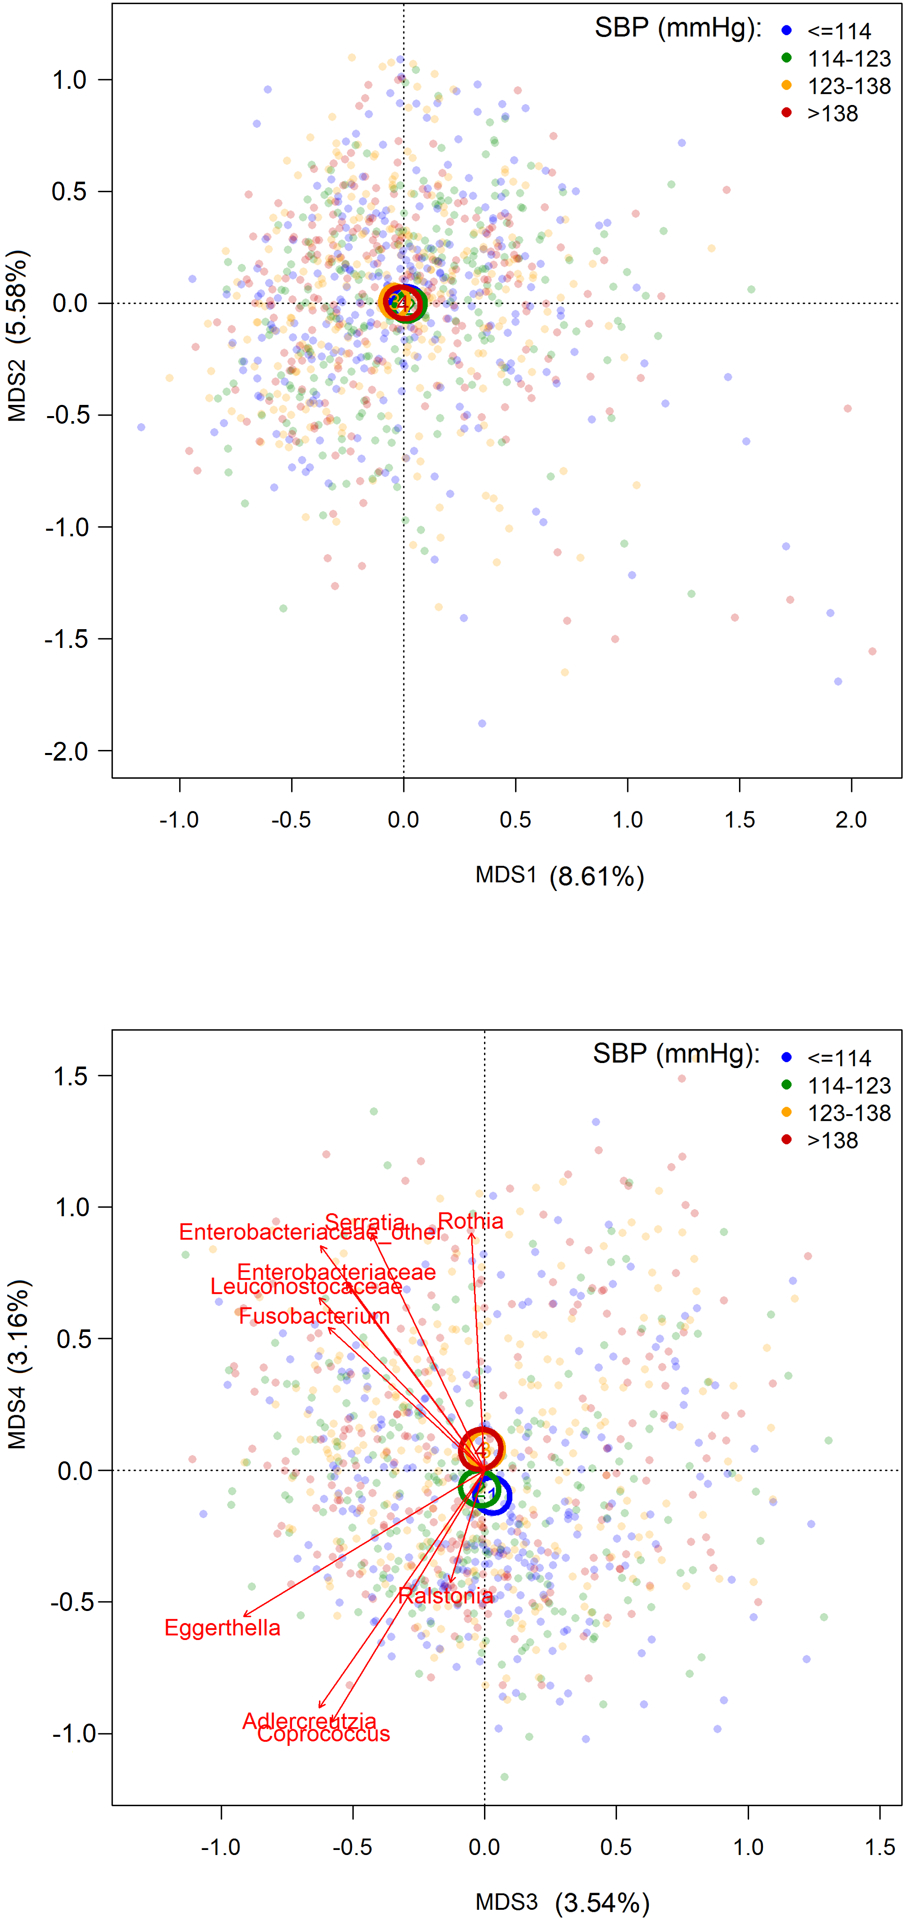
Figure 1. Microbial between-person diversity (β-diversity) assessed using principal coordinate analysis (PCoA) by systolic blood pressure (SBP).

MDS, multidivisional scaling. Centroids illustrate the 95% CI for the mean location of each SBP (mmHg) quartile. Vectors for 10 taxa with the greatest contributions to MDS4 indicate the directions and strengths of their correlations with MDS4 (Table S1). In permutational multivariate analysis of variance (PERMANOVA, n=1003), SBP had R2 of 0.20% and p-value of 0.002, after adjusting for age, sex, provinces, urbanization index (≤64.2, 64.2–81.5, >81.5), per-capita household income (≤10, 10–21.6, >21.6), education, total energy intake, animal-source food, sodium, physical activity (≤57.4, 57.4–152, >152), smoking, alcohol, and estimated glomerular filtration rate (eGFR). Results remained the same after additional adjustment of BMI.
