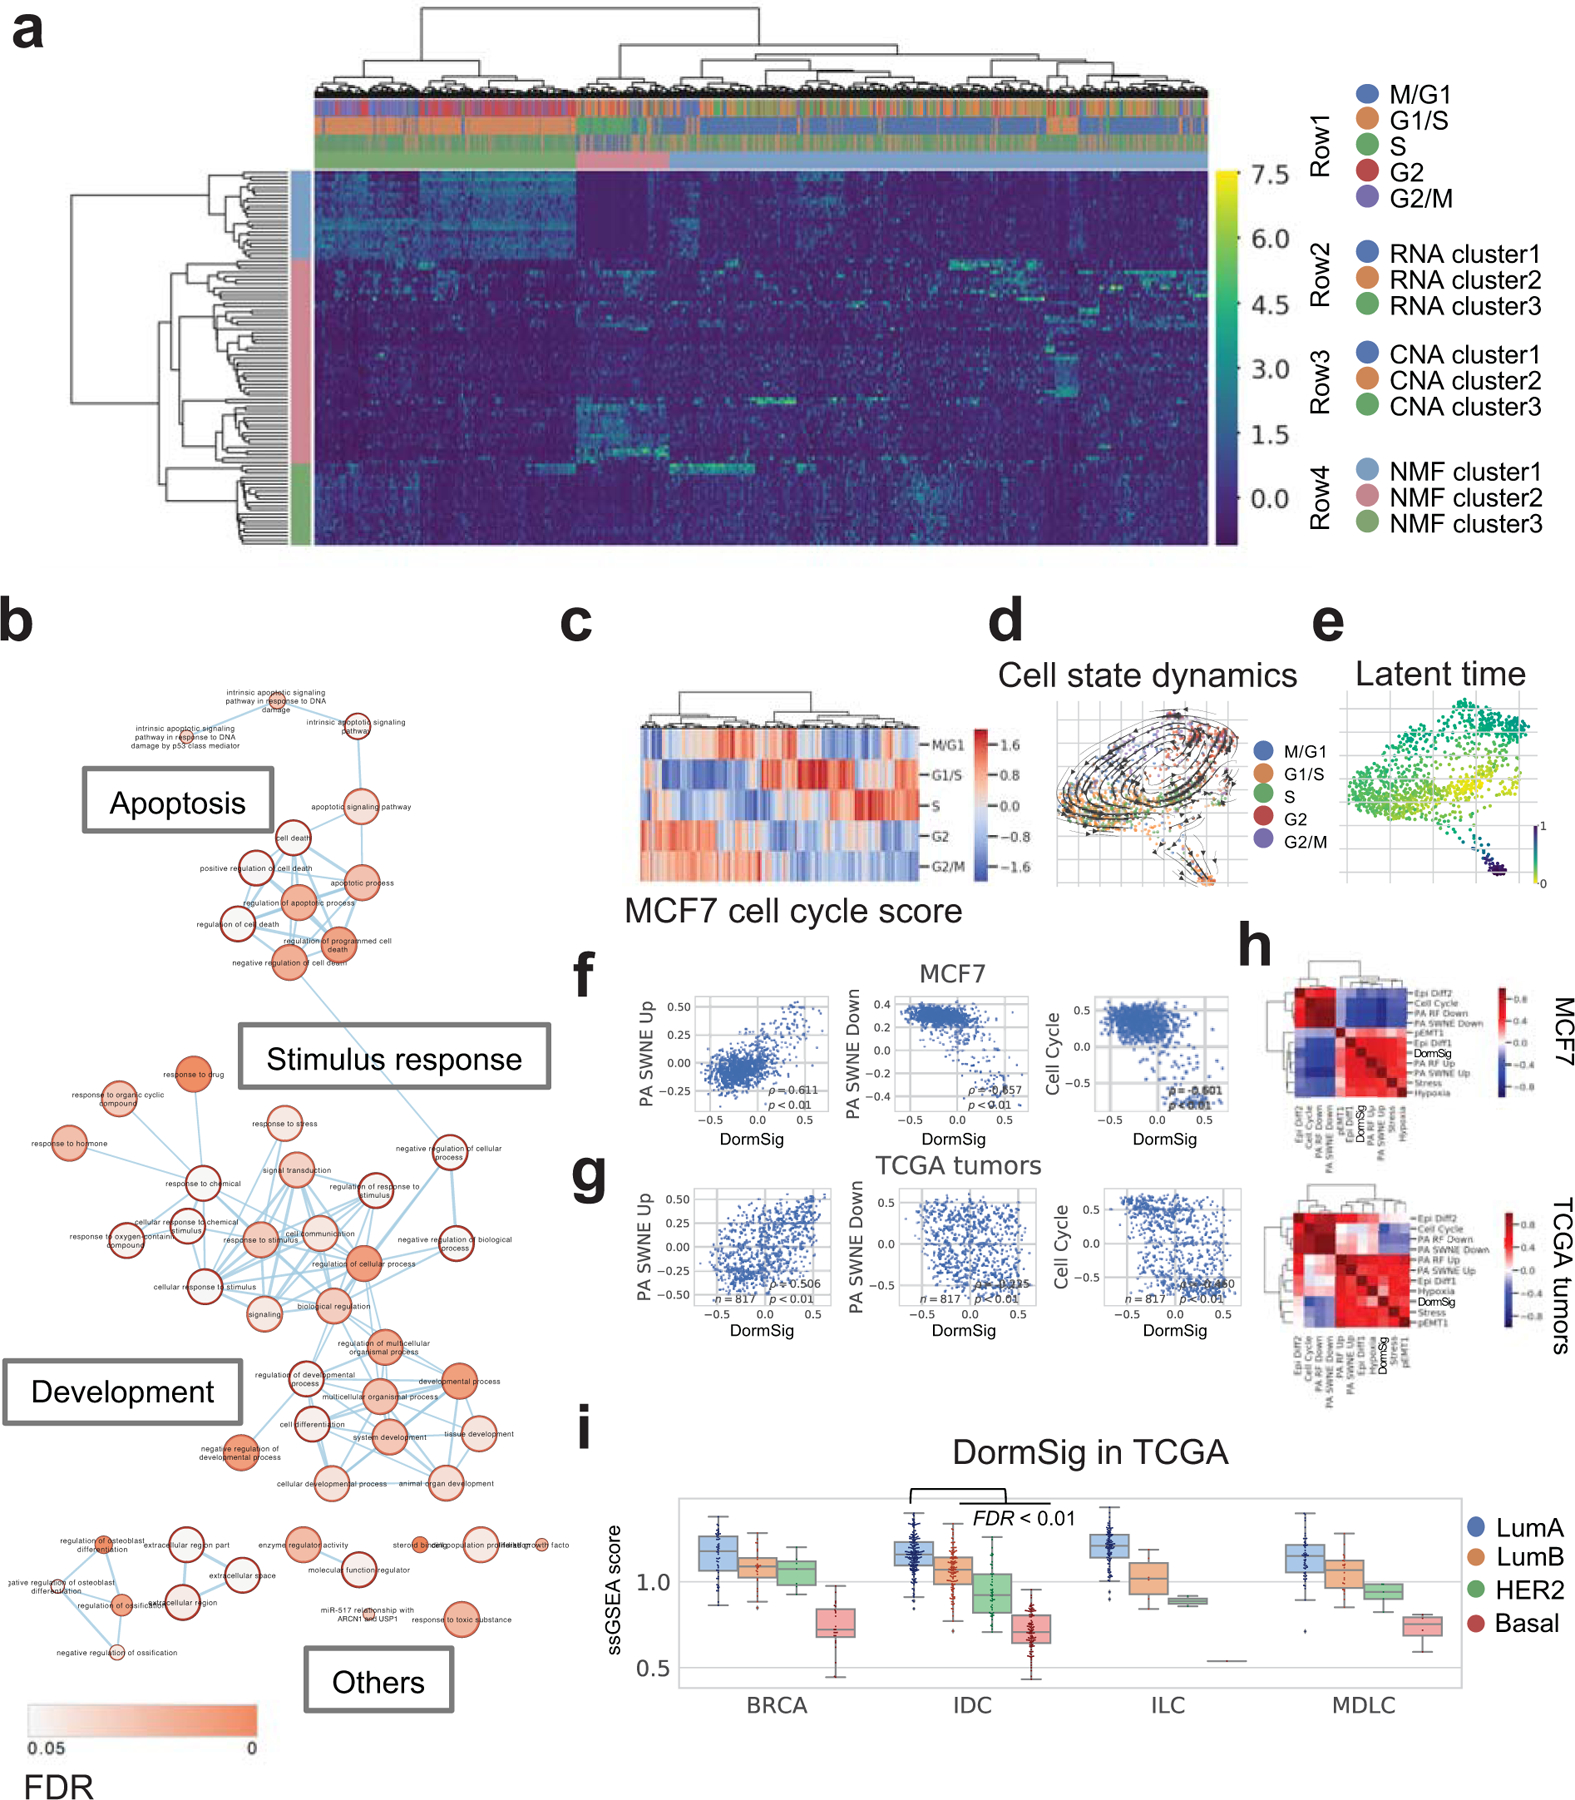
Fig. 3. Transcriptomic heterogeneity in MCF7 cells.

a. Clustering by Non-negative Matrix Factorization (NMF) in MCF7 cells (n=977). The first three rows of top bar showed respectively: cell cycle (row 1), RNA clusters (Louvain method, three clusters at resolution=0.4) (row 2) and CNA clusters (row 3). NMF clusters of cells and corresponding genes are shown in row 4 of top bar and the side bar.
b. GO enrichment of marker genes of NMF cluster 2 cells (pink side bar in Fig. 3a). Terms connections based on similarity; nodes colored by enrichment FDR (over-representation test, BH adjustment) in Cytoscape 3.7.1.
c. Cell cycle phase scores and assignments of MCF7.
d. Dynamical changes of cell states through the cell cycle. Cells are colored by the assigned phase in the force-directed graph drawing 2D layout. Arrows show directions of cell state transition from RNA velocity analysis.
e. Latent time among MCF7 cells from RNA velocity analysis, indicating developmental stages.
f. Co-expression of GSVA scores of DormSig with selected signatures in MCF7 cells (n=977). Correlation showed by Pearson ρ and p.
g. Co-expression of GSVA scores of DormSig with selected signatures (as in f) in TCGA breast tumors (n=817). Correlation showed by Pearson ρ and p.
h. Pearson correlation of GSVA scores of DormSig with selected signatures in MCF7 cells (n=977) and primary breast tumors from TCGA (n=817). Hierarchical clustering was performed using Euclidean distance and Ward’s method.
i. Single sample GSEA (ssGSEA) scores of DormSig in different subtypes of breast cancer from TCGA. (LumA: luminal A, LumB: luminal B, Her2: HER2-enriched, Basal: Basal-like; BRCA: breast cancer with unannotated histological subtype, IDC: invasive ductal carcinoma, ILC: invasive lobular carcinoma, MDLC: mixed ductal/lobular carcinoma). DormSig ssGSEA scores are higher in LumA IDCs (n=200) than each of the other subtypes in IDC tumors (LumB: n=122, Her2: n=51, Basal: n=107) (FDR < 0.01, Wilcoxon test, BH adjustment).
