
Fig. 4. Differentially activated pathways in CDH1 KO vs WT T47D cells and ILC vs IDC tumors.
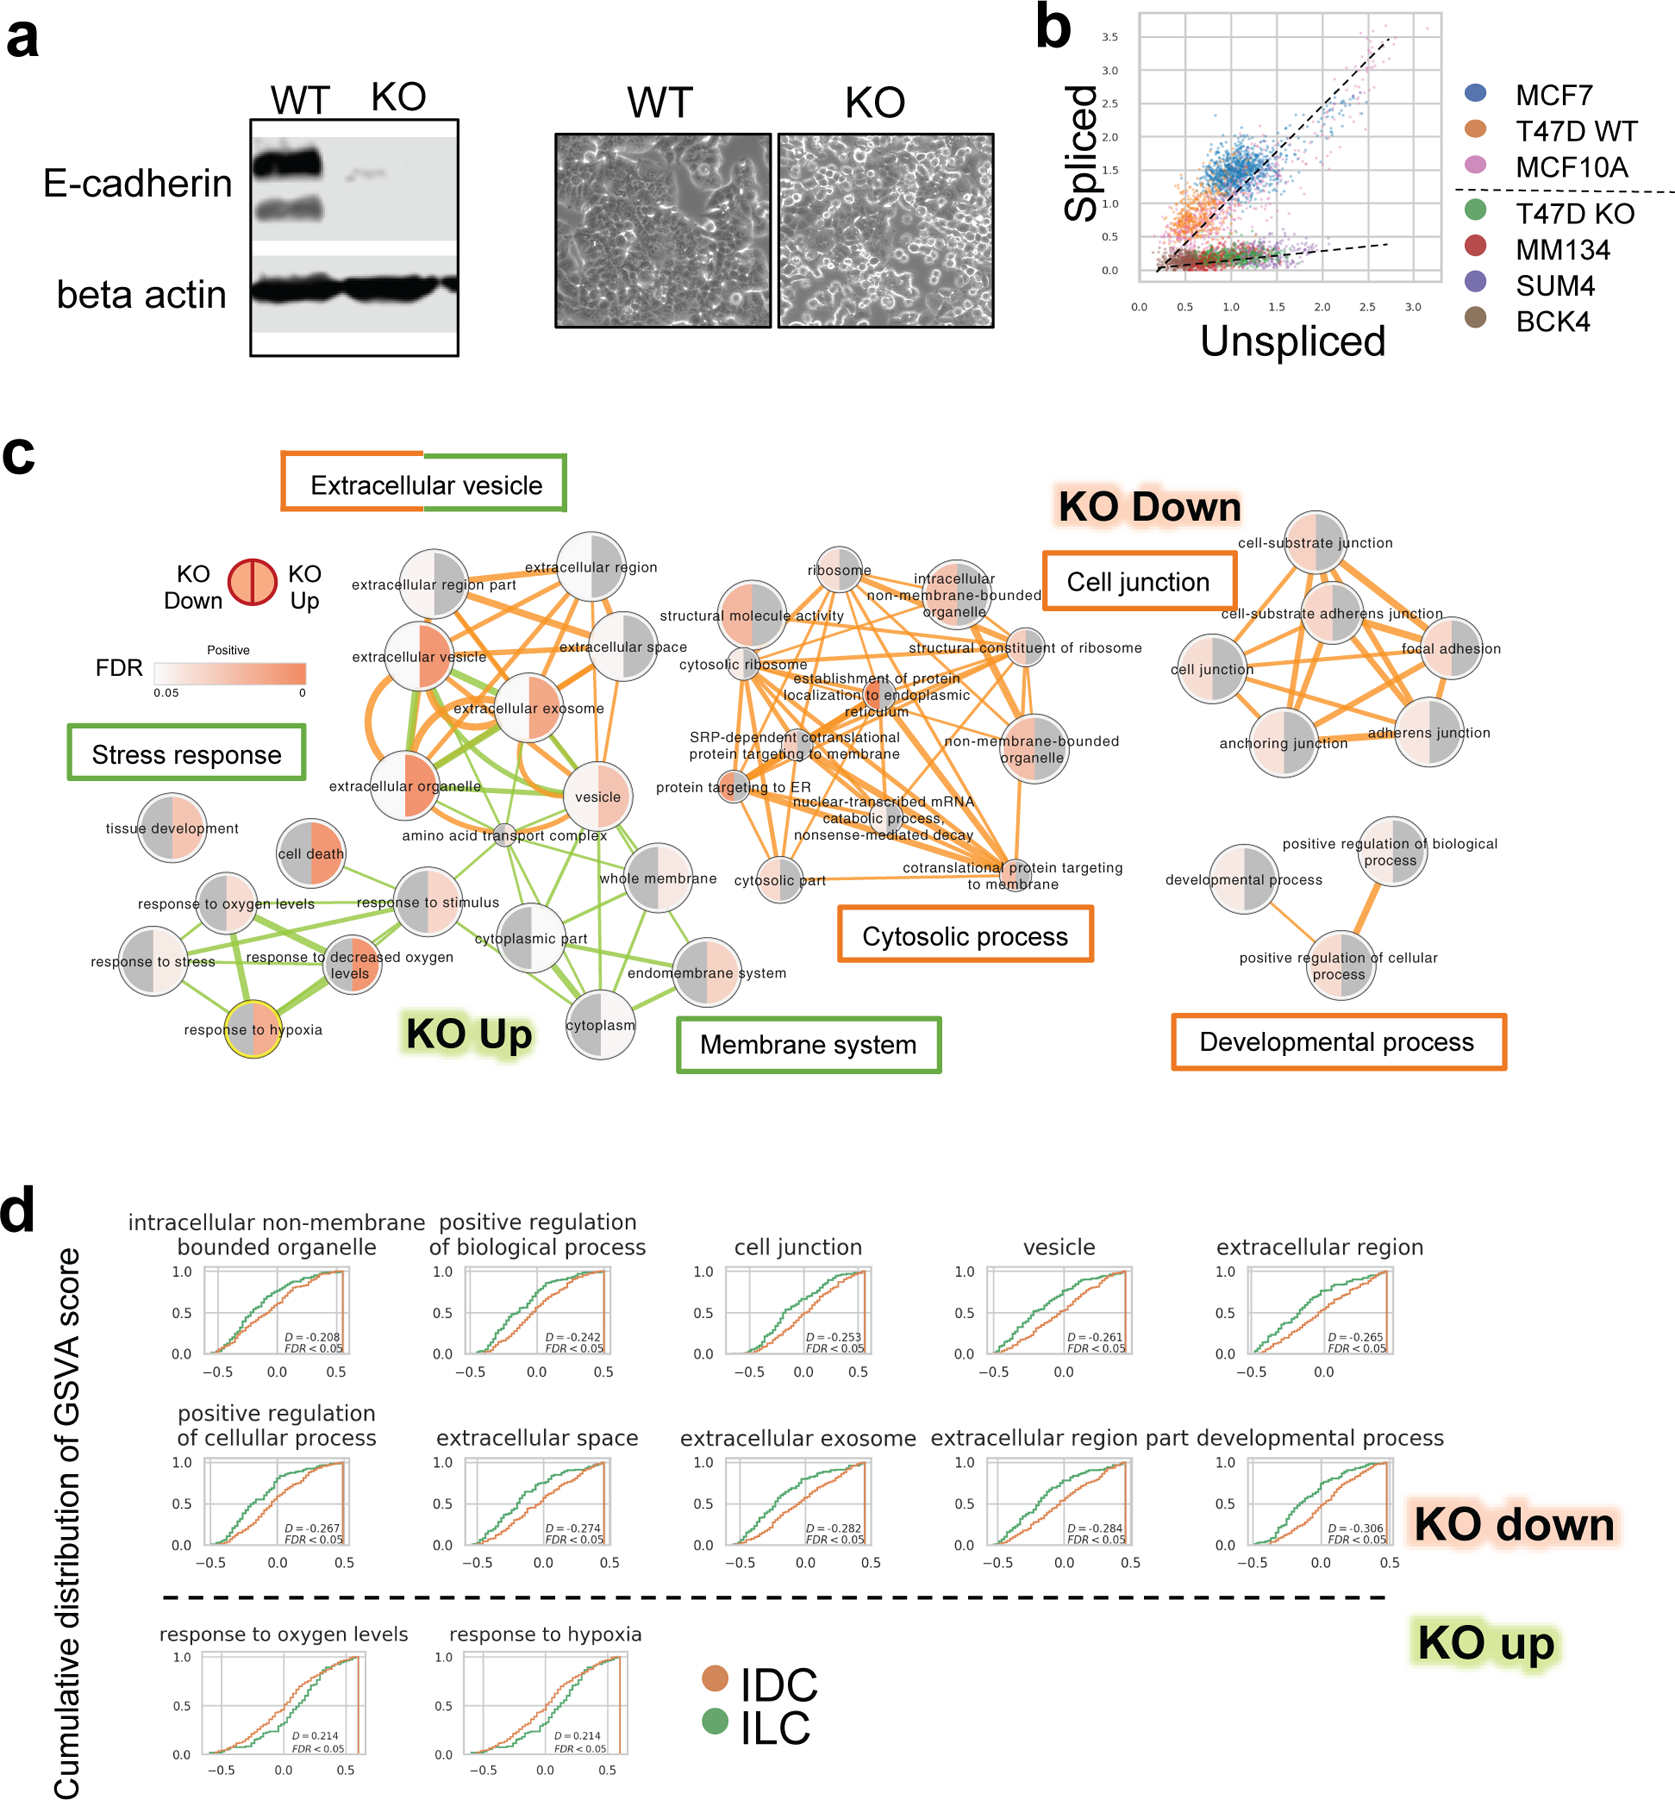
a T47D KO and WT cells. Left: E-cadherin expression by WB. Right: morphology under microscope
b. Normalized unspliced and spliced CDH1 RNA abundance among single cells.
c. Enriched Gene Ontology terms of down (red linked) and up (green linked) regulated genes after CDH1 KO in T47D cells. Terms connections based on similarity; nodes colored by enrichment FDR (over-representation test, BH adjustment) in Cytoscape 3.7.1.
d. Cumulative distribution of GSVA scores of selected signatures in TCGA LumA IDC (n=200) and ILC (n=106) tumors. Right shifted curve indicates distribution of higher score values.