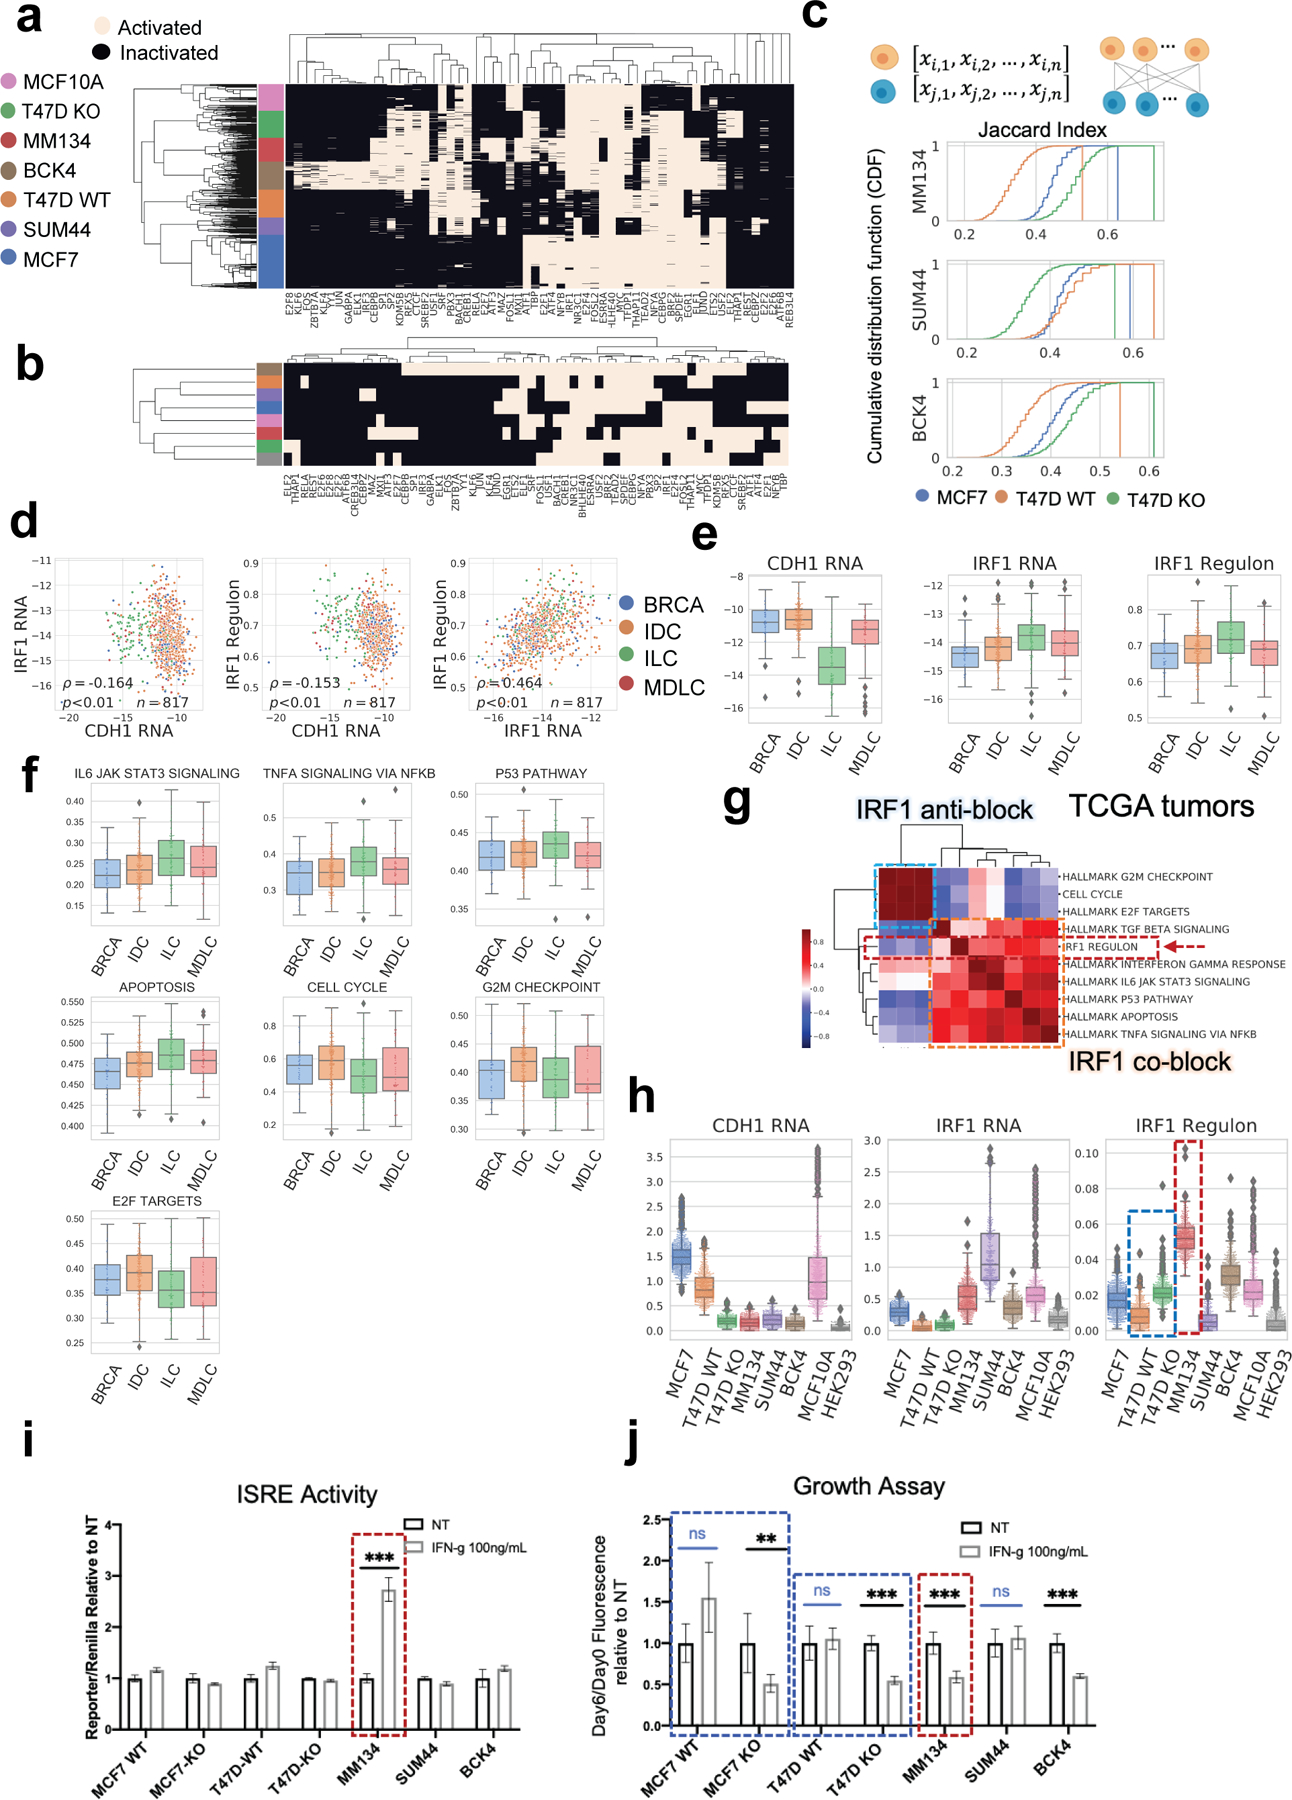
Fig. 5. Regulon activation states in breast cell lines and TCGA tumors.

a. Binarized regulon activation profiles of each breast single cell deduced from scRNA-seq with pySCENIC.
b. Binarized TF activation profile for each breast cell line, based on the majority of single cell states in a. Hierarchical clustering by Jaccard distance, ward method.
c. Regulon activation similarity between each ILC cell line (reference) to MCF7, T47D WT and T47D KO (query), quantified by Jaccard Index. For each reference cell line (per row, labeled on y axis), Jaccard Index was calculated between individuals in the reference population and every single cell of the three query breast cell lines respectively, depicted in cumulative distribution. Larger Jaccard Index indicates higher similarity.
d. Log normalized expression of CDH1 RNA, IRF1 RNA, and AUC score of IRF1 regulon in breast cell lines. Difference between IDCs and ILCs are significant (FDR<0.05) in all the three cases.
e. Expression of CDH1, IRF1 (log normalized RNA abundance) and IRF1 regulon (ssGSEA score) in TCGA LumA cases. Difference between IDCs and ILCs are significant (FDR<0.05) in all the three cases.
f. ssGSEA scores of selected signatures (as in Fig. 5g) which showed significant difference between TCGA LumA IDC (n=200) and ILC (n=106) tumors. Signatures except for IRF1 Regulon or Cell Cycle are from MSigDB hallmark database. Difference between IDCs and ILCs are significant (FDR<0.05) in all cases.
g. Pearson correlation of ssGSEA scores of IRF1 regulon with relevant functional signatures in TCGA tumors (n=817). Signatures are divided to IRF1 co-block, which show positive correlation with IRF1 regulon; or IRF1 anti-block, which show negative correlation with IRF1 regulon.
h. Expression of CDH1, IRF1 (log normalized) and IRF1 regulon (AUC score from pySCENIC) in breast cell lines.
i. Relative ISRE transcriptional activity of IFN-γ (100ng/mL) stimulated cells than the non-treated group (six technical replicates for each group).
j. Relative growth at day 6 post IFN-γ (100ng/mL) stimulation compared to the non-treated group (six technical replicates for each group), by dsDNA Fluorescence quantification.
