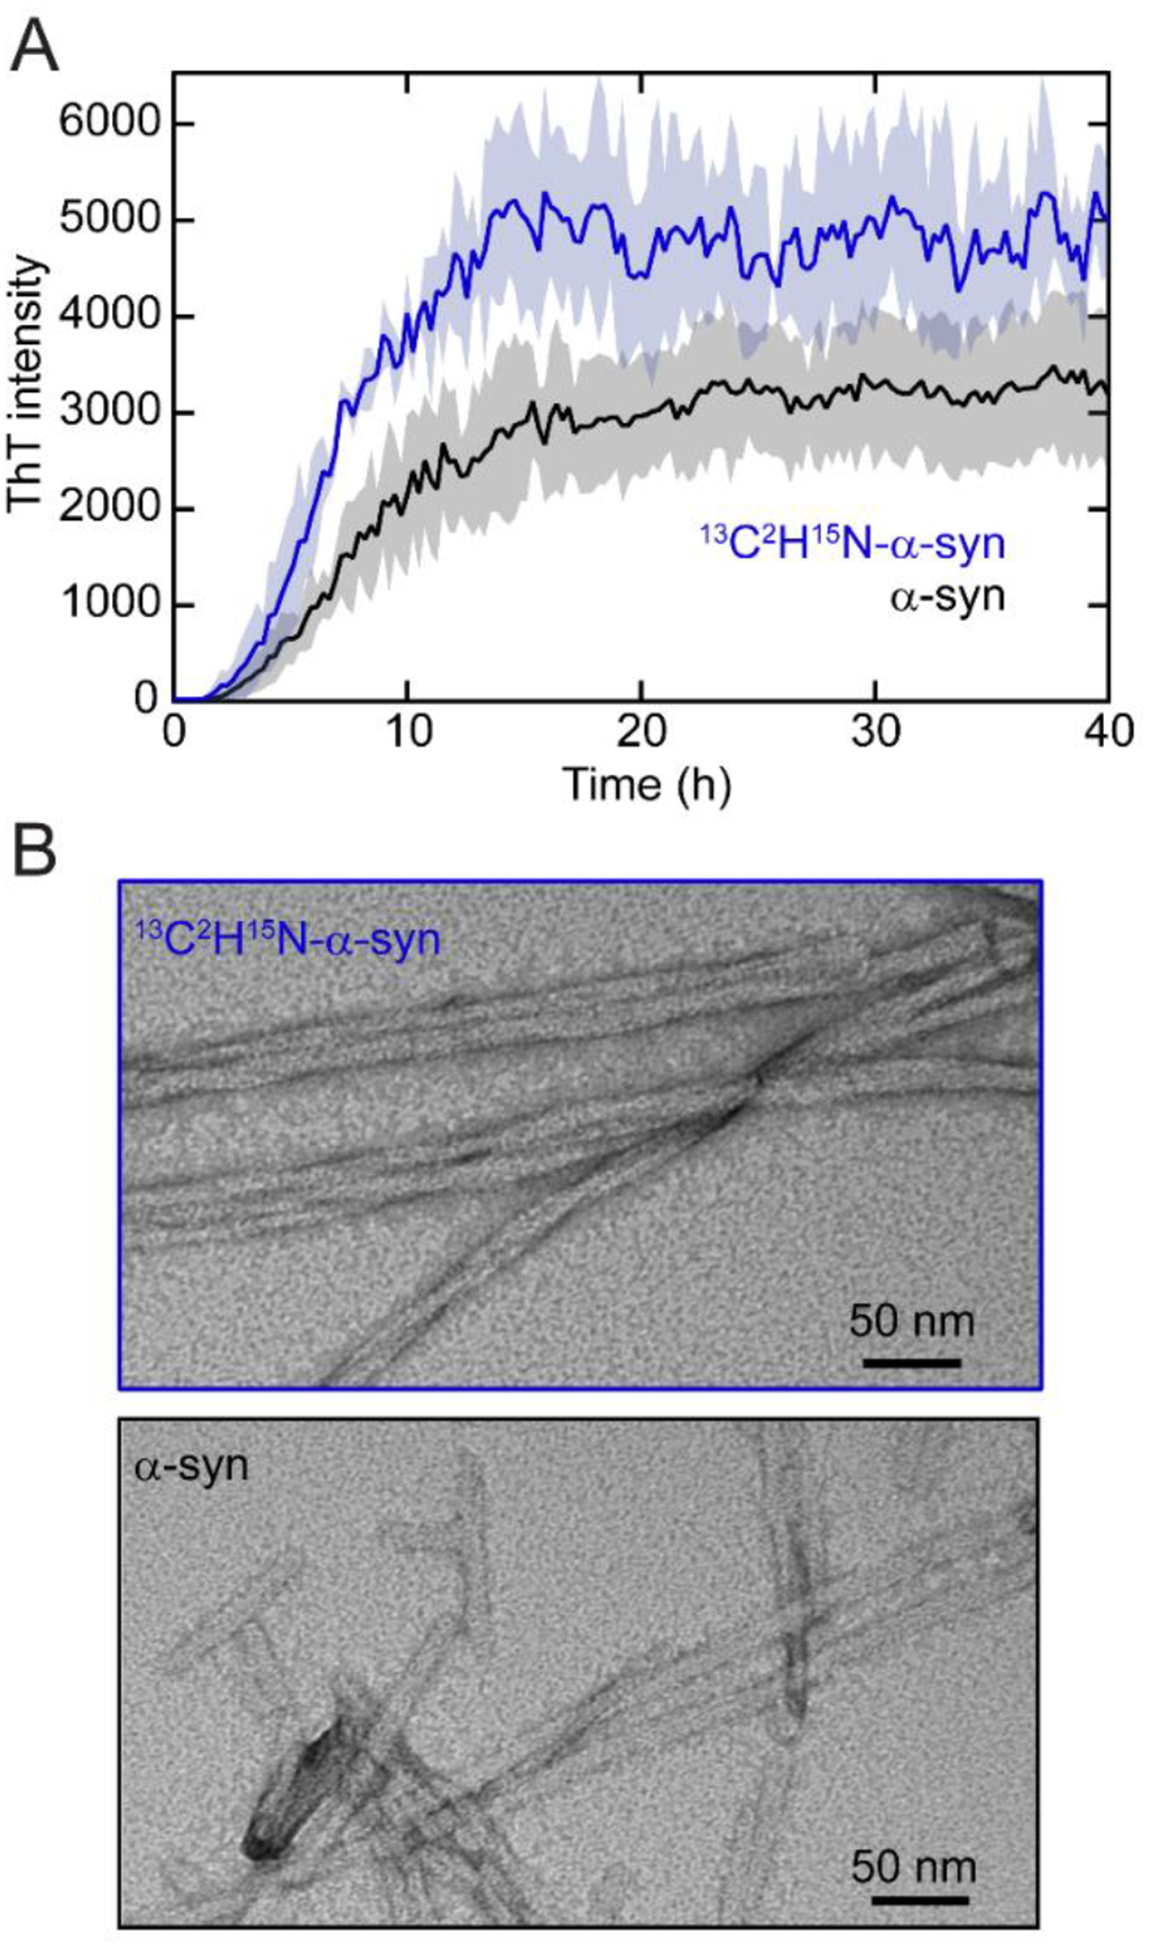
Fig. 2. Amyloid formation of 13C2H15N-α-syn.

(A) ThT-monitored aggregation kinetics of natural abundance α-syn (black) and 13C2H15N-α-syn (blue). Averages (line) and standard deviations (shaded area) of three replicates are shown ([α-syn] = 50 μM and [ThT] = 5 μM in pH 5 buffer at 37 °C with shaking). (B) TEM images of 13C2H15N-α-syn (top) and α-syn (bottom) fibrils. Scale bars are as indicated.
