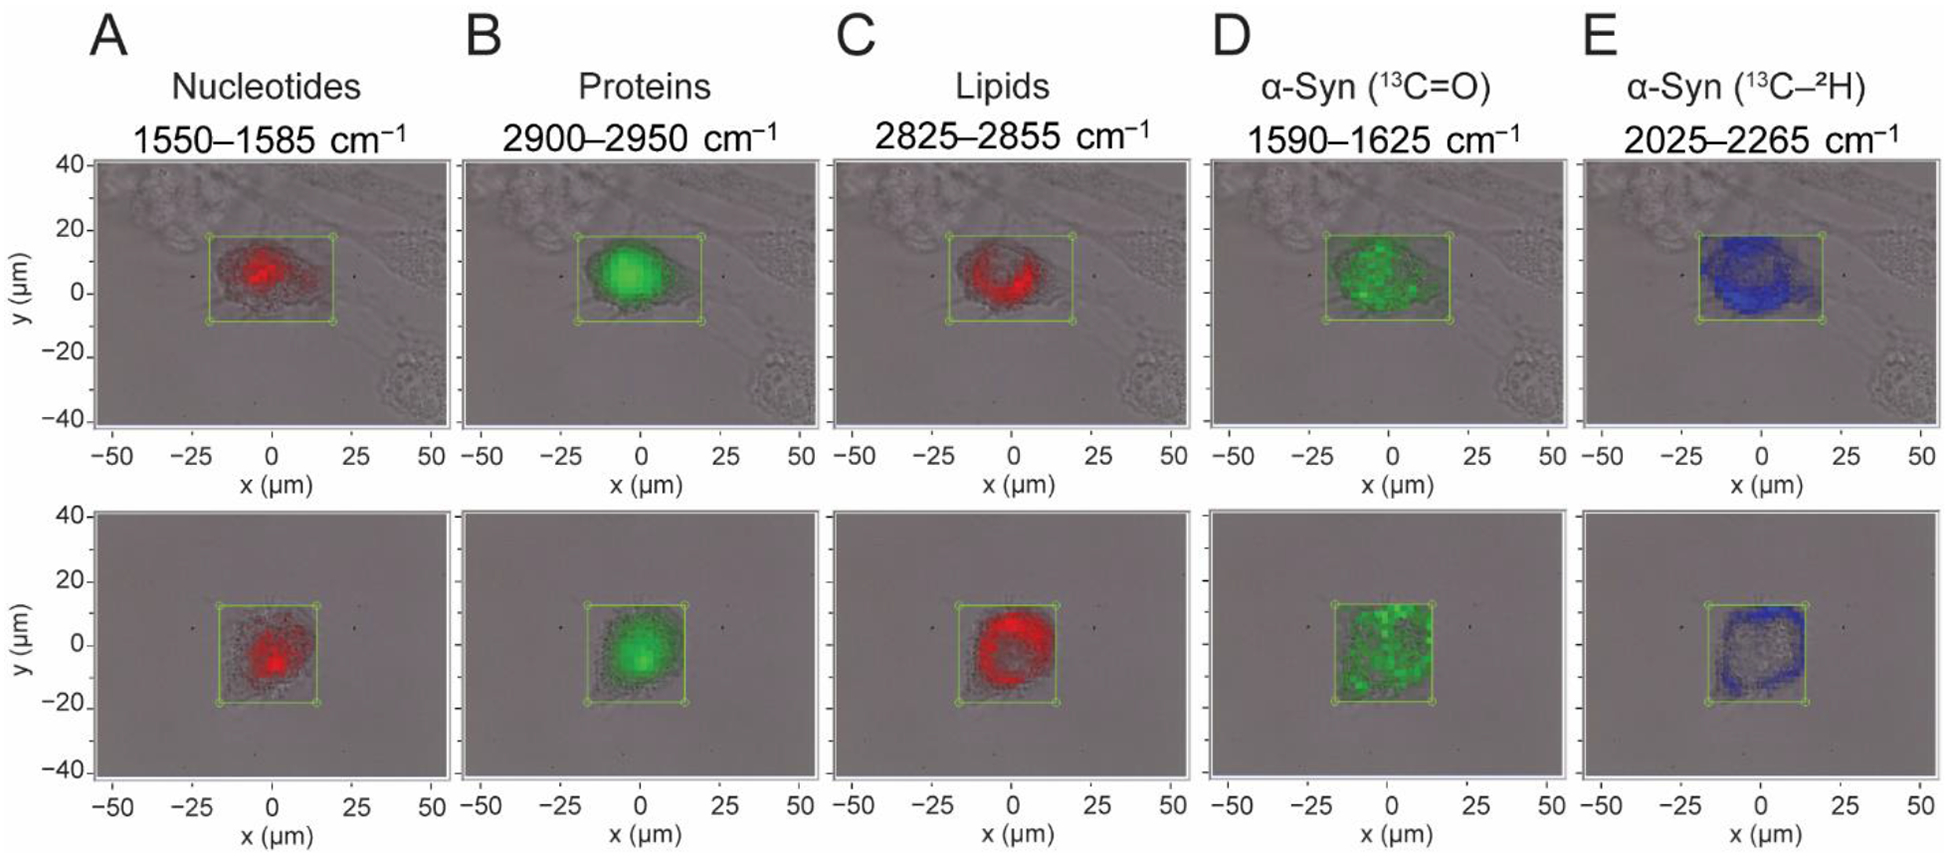
Fig. 4. Raman spectral imaging of SK-MEL-28 cells treated with 13C2H15N-α-syn fibrils.

Maps of two individual cells indicating the locations of endogenous biomolecules including (A) nucleotides, (B) proteins, (C) lipids, along with the presence of 13C2H15N-α-syn fibrils as determined by (D) 13C=O amide-I and (E) 13C–2H stretching bands, generated by integrating regions of the Raman spectrum as indicated. Maps are overlaid with bright-field images, and boxes indicate the measurement area (2 μm steps).
