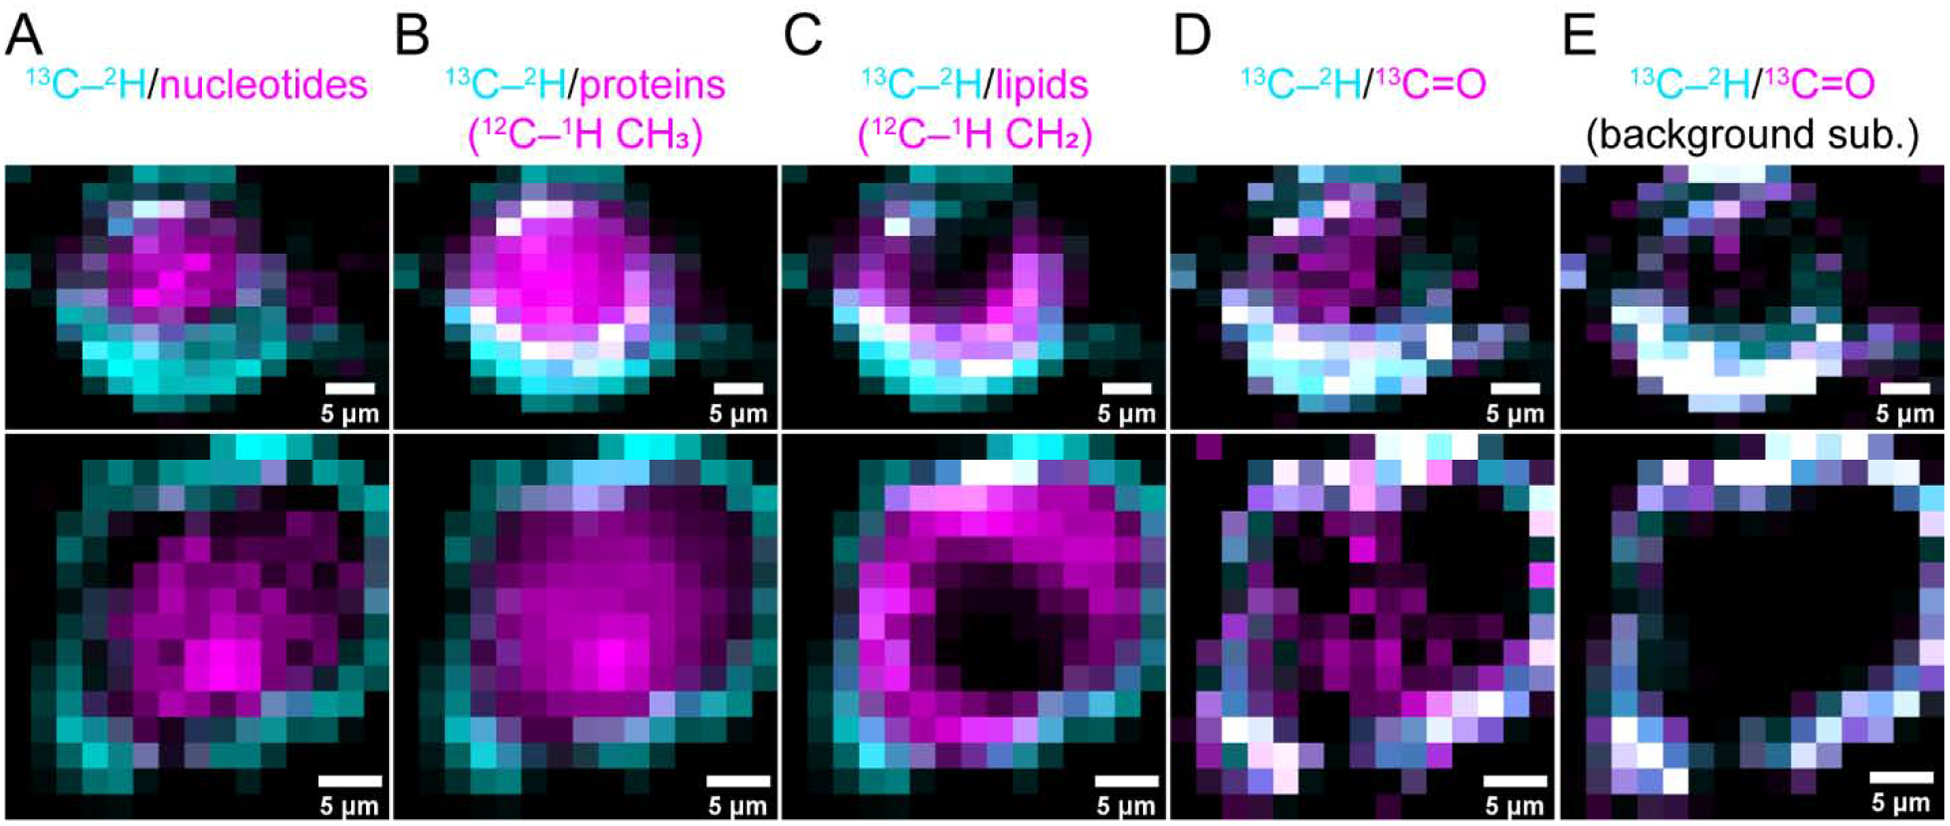
Fig. 5. Colocalization Raman maps.

Composite Raman maps of 13C–2H stretching bands (cyan, 2025–2265 cm−1) with other biomolecules including (A) nucleotides (magenta, 1550–1585 cm−1), (B) endogenous proteins (magenta, 2900–2950 cm−1), and (C) lipids (magenta, 2825–2855 cm −1) as well as with the 13C=O amide-I peaks before (D) and after (E) cellular background subtraction (magenta, 1590–1625 and 1598–1626 cm−1, respectively). Colocalized areas appear as white. Two individual cells are shown in the upper and lower panels. Scale bars are as indicated.
