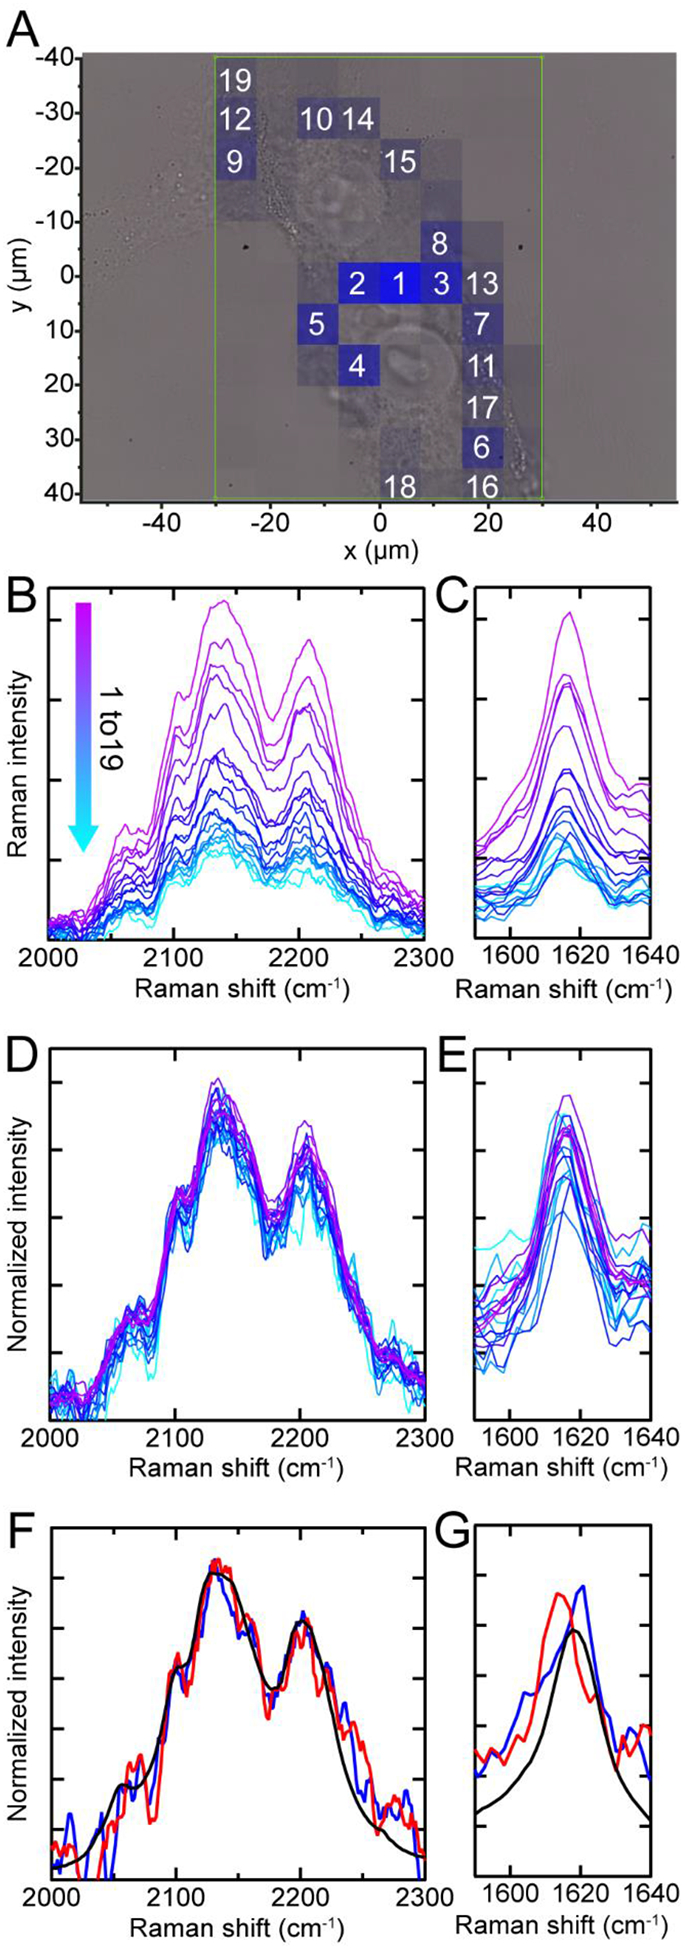
Fig. 6. Raman spectra of internalized fibrils.

(A) Raman map of 13C–2H stretches (blue) overlaid with the bright-field image. Box indicates measurement area (7.5 μm steps). Raman spectra in the 13C–2H stretching and the amide-I regions with cellular background subtracted (B and C) and normalized by the area of the 13C–2H stretching bands (D and E). Their respective spatial locations are indicated by numbers in (A). The intervening spectral region was omitted for clarity. Comparison of additional Raman spectra (red and blue) to in vitro fibrils (black) in the 13C–2H (F) and 13C=O amide-I (G) regions. These are averaged and normalized spectra from two additional cells.
