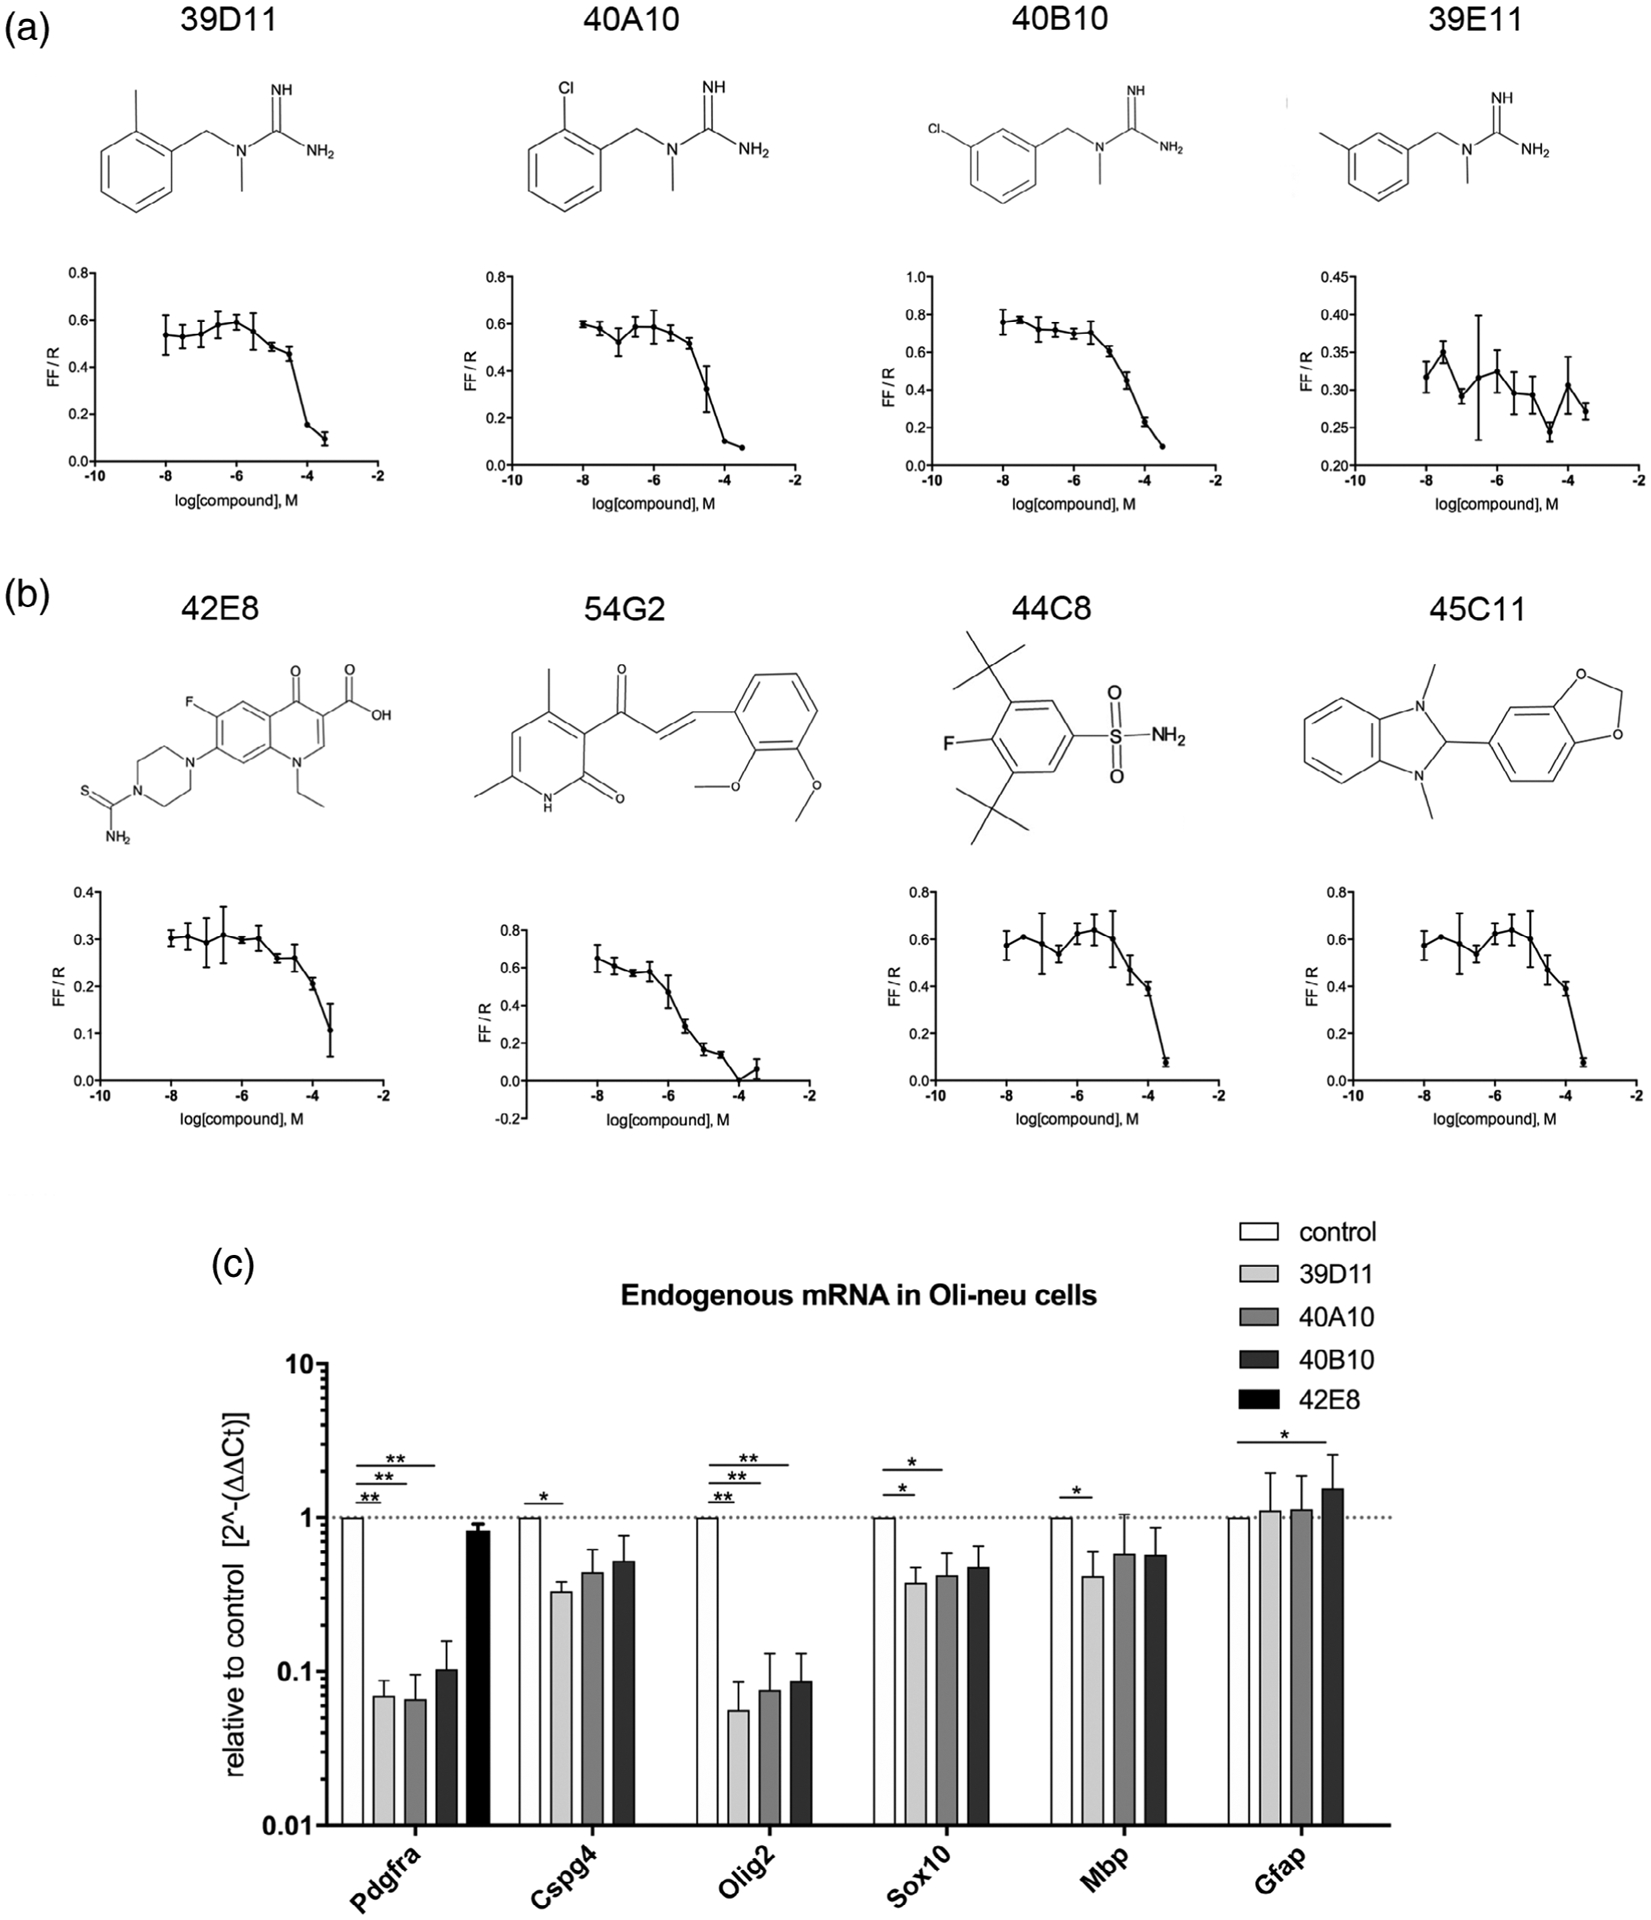
FIGURE 2.

Effects of hits from the primary screen on Pdgfra transcription in Oli-neu cells. (a,b) Dose-response analyses of four guanidine compounds a) and four nonguanidine compounds (b) by luciferase assays using Oli-neu cells transfected with Pdgfra-luc. The y-axes represent firefly luciferase activity normalized to renilla luciferase in response to 2 days of incubation in 50 μM 3.3-fold serially diluted compounds. The structure of each compound is depicted above the graph. (c) Relative quantification of mRNA encoding Pdgfra, Cspg4, Olig2, Sox10, Mbp, and Gfap. Total RNA from Oli-neu cells treated with 50 μM compounds was used for quantitative PCR (qPCR), and the results are plotted relative to the levels in control cells treated with dimethyl sulfoxide (DMSO) (value of 1, dotted line). The y-axis is indicated on a log10 scale to reflect the magnitude of up- (above 1) and down (below 1)-regulation. * p < .05, ** p < .01, two-way analysis of variance (ANOVA), uncorrected Fisher’s LSD test. Dotted line represents y = 1.0
