FIGURE 3.

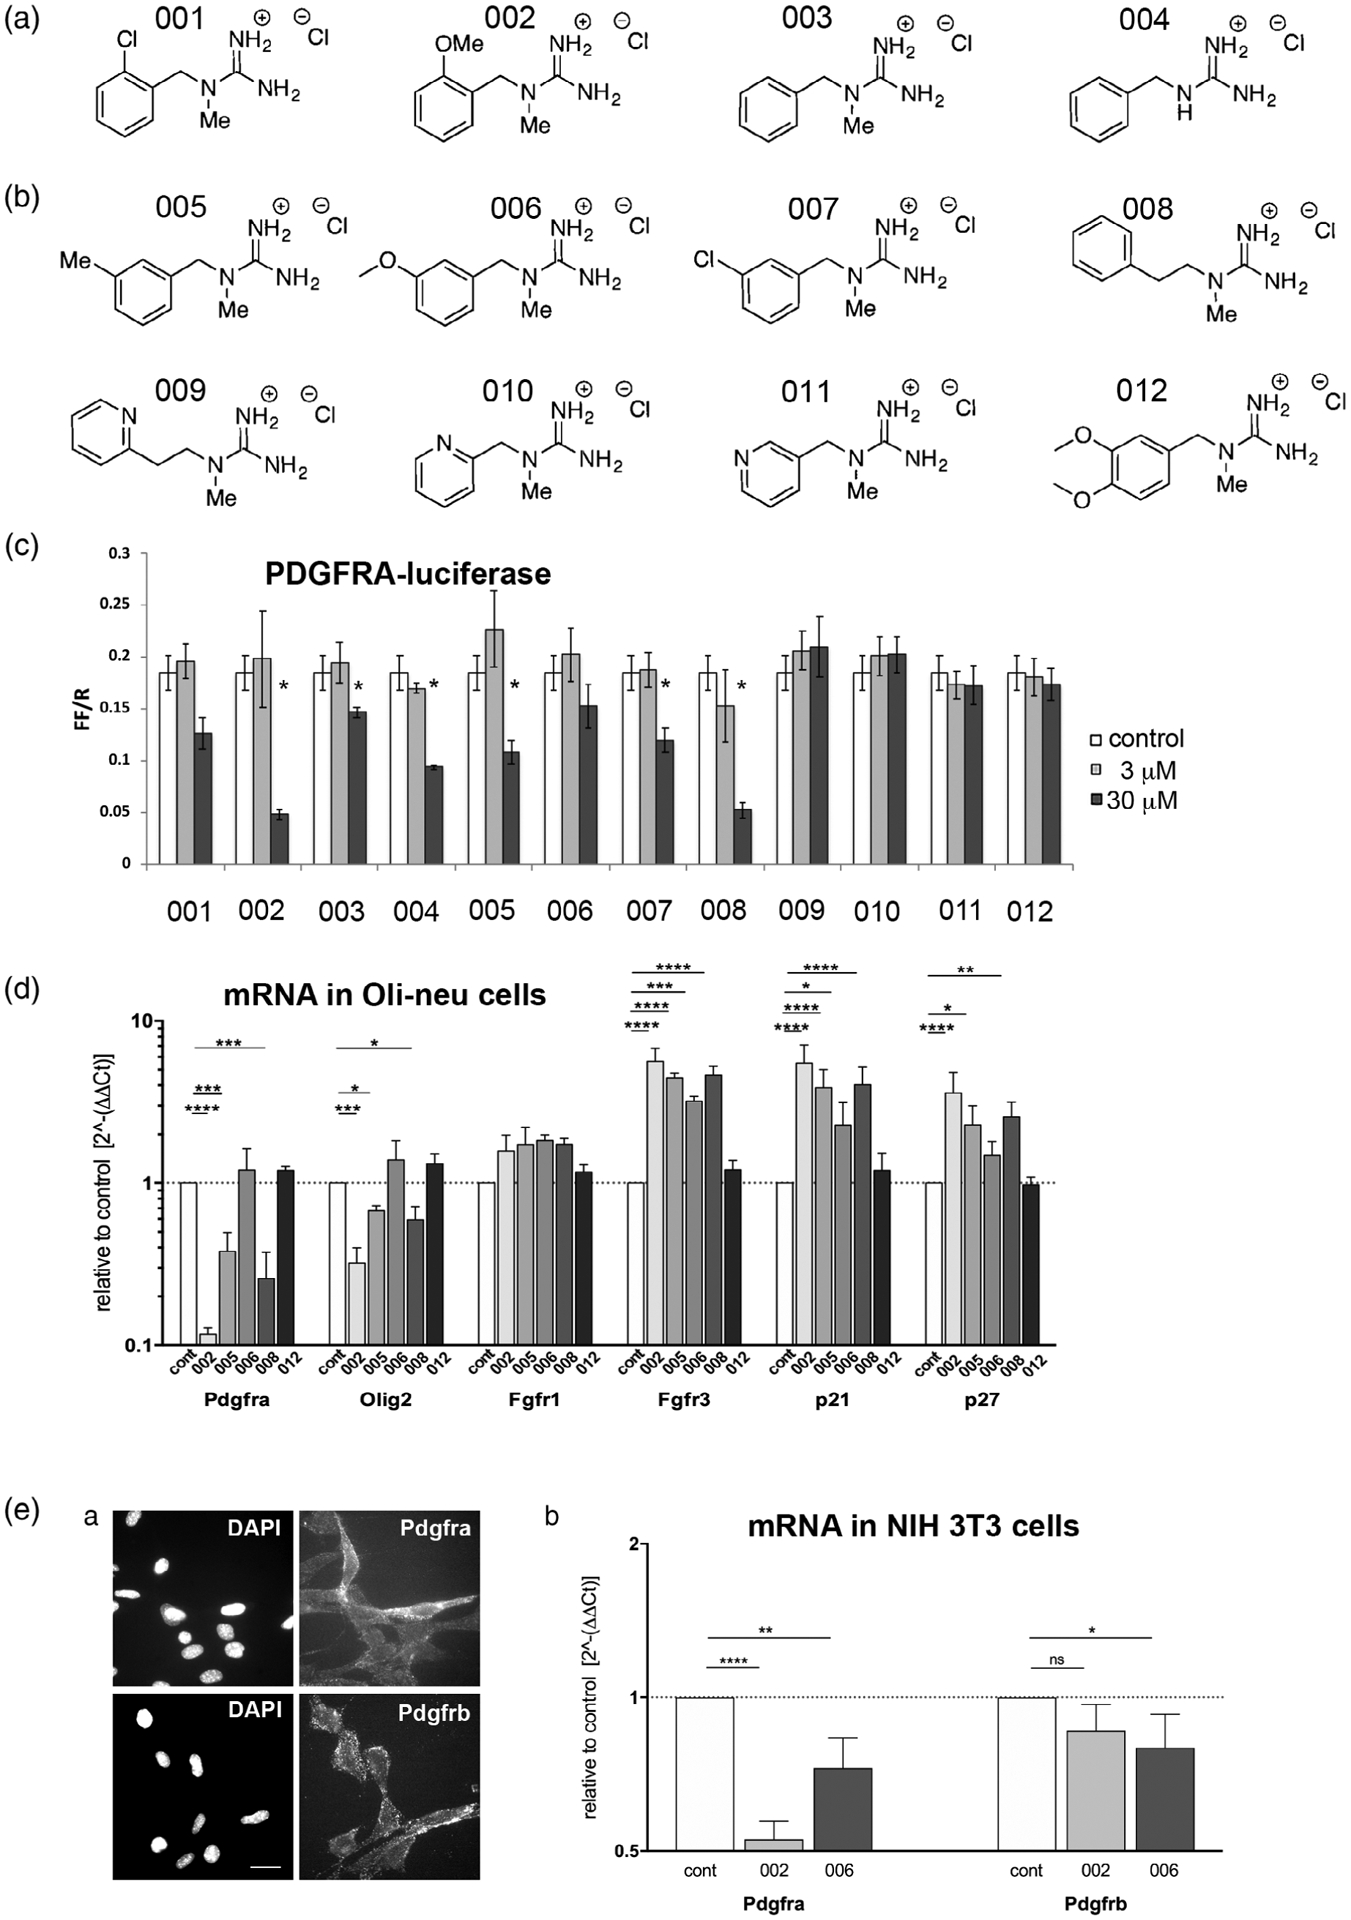
Newly synthesized guanidine compounds. (A) Chemical structure of the newly synthesized guanidine compounds. (B) Effects of the compounds on Pdgfra-luc activity in Oli-neu cells at 3 and 30 μM. White bars represent control dimethyl sulfoxide (DMSO)-treated cells. *p < .05. (C) Quantification of mRNA encoding Pdgfra, Olig2, Fgfr1, Fgfr3, p21Cip1 (Cdkn1a), and p27kip1 (Cdkn1b) after treatment of Oli-neu cells for 2 days with 50 μM guanidine compounds. The y-axis represents values relative to the levels in control DMSO-treated cells (dotted horizontal line) on a log10 scale. * p < .05, ** p < .01, *** p < .001, **** p < .0001, two-way analysis of variance (ANOVA), uncorrected Fisher’s LSD test. (D) Pdgfra and Pdgfrb expression on NIH3T3 mouse fibroblasts. (a) Immunofluorescence labeling of live unfixed NIH 3T3 cells using rabbit antibodies to Pdgfra (top) and Pdgfrb (bottom). Scale bar, 20 μm. (b) Effects of compounds 002 and 006 on Pdgfra and Pdgfrb mRNA levels examined by quantitative PCR (qPCR). Y-axis represents mRNA levels relative to control DMSO-treated cells (dotted horizontal line), plotted on log2 scale. * p < .05, ** p < .01, **** p < .0001, two-way analysis of variance (ANOVA), uncorrected Fisher’s LSD test
